The chart below shows the annual average lower troposphere temperature to 2015, with the February anomaly shown as a line at the top.
 |
| Figure 1 | Lower troposphere temperature changes from 1979 to 2015. The chart shows the annual average temperature anomaly with the anomaly for February 2016. Data sources: UAH and Roy Spencer's blog |
This next chart is for the month of February only, from February 1979 to February 2016:
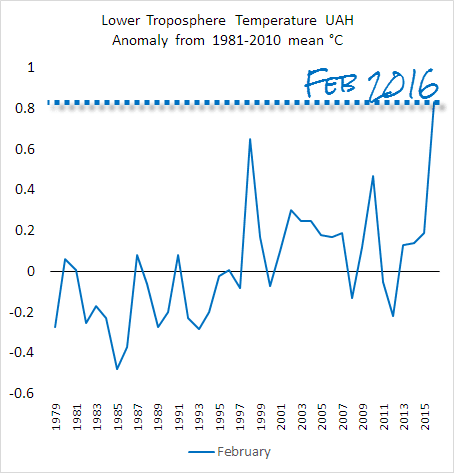 |
| Figure 2 | Lower troposphere temperature changes from 1979 to 2015 for February only. Data sources: UAH and Roy Spencer's blog |
Tracking El Niño years
Next here is a chart showing selected recent El Niño years with the UAH lower troposphere data:
 |
| Figure 3 | Lower troposphere temperature changes for selected El Nino years. Data sources: UAH and Roy Spencer's blog |
Update: RSS is out now for February (v3.3), so here is how this year's El Nino fares compared to recent ones. February is the hottest February at 0.974 C above the 1979 to 1998 mean. The previous hottest February was in 1998 at 0.736 C above the baseline. The previous highest anomaly in any month was in April 1998, at 0.857 C above the 1979 to 1998 mean.
 |
| Figure 3a | Lower troposphere temperature changes for selected El Nino years. Data source: RSS |
Added by Sou 7:00 am AEDT 3 March 2016
In the next couple of months the lower troposphere could even go a tad higher, going by past experience.
The chart below compares months from January 1979 through to February 2016, and includes a linear trend line for the whole period. As shown on the chart, the February anomaly is a bit higher than the previous highest anomaly, which was in April 1998.
 |
| Figure 4 | Lower troposphere monthly temperature changes from January 1979 to February 2016. Data sources: UAH and Roy Spencer's blog |
Last month, after releasing the January data, Roy Spencer wrote on his blog:
We are now approaching peak warmth in the tropics due to El Nino conditions. Only time will tell if warming continues for a few more months, or whether January was the peak.That surprised me, because I thought he would have noticed that the lower troposphere could continue to get even warmer from February through to April. (He hasn't made any such statements this time around.)
Comparing the lower troposphere with the surface
The trend for the lower troposphere from January 1979 to February 2016 at 0.1 °C/decade is still lower than the rate of surface warming over almost the same period 0.14 °C/decade (minus one month - to January 2016). The chart below shows the difference in the trends. It's a bit messy because it's a monthly chart. The main thing I want to illustrate is the trend of each. They aren't hugely different, however one would have expected that the UAH trend would be higher, if anything.
 |
| Figure 5 | Global temperature changes from January 1979 to February 2016 for the lower troposphere and from January 1979 to January 2016 for the surface. Data sources: UAH and Roy Spencer's blog and GISS NASA |
As remarked upon in other articles (and elsewhere), the lower troposphere temperatures diverged from those of the surface earlier this century.
Where the differences lie in the lower troposphere
If you want to explore a bit further, most of the recent increase is in the northern hemisphere. Below is a chart showing the annual average for the northern hemisphere only (1979 to 2015), with February 2016 shown as a line. The February anomaly is 1.17 C or 2.1 F above the 1981 to 2010 mean.
 |
| Figure 6 | Lower troposphere temperature changes from 1979 to 2015 for the northern hemisphere. The chart shows the annual average NH temperature anomaly with the NH anomaly for February 2016. Data sources: UAH and Roy Spencer's blog |
Compare that with the tropics, where the February anomaly is 0.99 C or 1.78 F above the 1981-2010 average.
 |
| Figure 7 | Lower troposphere temperature changes from 1979 to 2015 for the tropics. The chart shows the annual average temperature anomaly in the tropics with the tropics anomaly for February 2016. Data sources: UAH and Roy Spencer's blog |
Then the southern hemisphere, where the February anomaly is 0.5 C or 0.9 F above the 1981 to 2010 average.
 |
| Figure 8 | Lower troposphere temperature changes from 1979 to 2015 for the southern hemisphere. The chart shows the annual average SH temperature anomaly with the SH anomaly for February 2016. Data sources: UAH and Roy Spencer's blog |
It strikes me that the temperature changes in the lower troposphere are not inconsistent with the large surface warming in the Arctic, which along with the El Niño surface warming in the tropics, could be contributing to the lower troposphere anomaly in the northern hemisphere.
Roy Spencer wrote on his blog:
The February warmth is likely being dominated by the warm El Nino conditions, which tends to have peak warmth in the troposphere close to February…but it appears that isn’t the whole story, since the tropical anomaly for February 2016 (+0.99 C) is still about 0.3 C below the February 1998 value during the super-El Nino of that year. In addition to the expected tropical warmth, scattered regional warmth outside the tropics led to a record warm value for extratropical Northern Hemispheric land areas, with a whopping +1.46 C anomaly in February…fully 0.5 deg. C above any previous monthly anomaly (!):
From the WUWT comments
News of the record hot February hasn't hit WUWT yet, so there are no "thoughts" to ponder.
From the HotWhopper archives
- Hottest January on record, with El Niño years comparison - February 2016
- Anthony Watts heroically defends cool satellites - January 2016
- The surface compared with the lower troposphere and the Daily Mail's big blooper - January 2016
>News of the record hot February hasn't hit WUWT yet, so there are no "thoughts" to ponder.<
ReplyDeleteWhat are the chances of one of Anthony's Orcs claiming that Roy Spencer is in on the global warming conspiracy, particularly given Roy's reference to a "a whopping +1.46 C anomaly in February"?
Perhaps a KGB sleeper mole like the Pope for example. :-)
Perhaps they're simply trying to clarify how they're going to start the "it's cooling" meme.
DeleteIt's like dating after the death of a loved one: they just need to decide how soon isn't too soon to give the apperance of undue haste.
Snap! Exactly what I was thinking, Mike H.
DeleteI predicted a while back that WUWT will have to throw Dr Spencer under a bus if they want to discredit the UAH data set.
DeleteIt depends on what the RSS figures are for February. They've always been happy to ignore UAH when it was showing much more warming than RSS.
DeleteBut there's going to be a new version of RSS - so they may go back to preferring UAH.
Deletehttp://journals.ametsoc.org/doi/abs/10.1175/JCLI-D-15-0744.1?af=R
"The new dataset shows substantially increased global-scale warming relative to the previous version of the dataset, particularly after 1998. The new dataset shows more warming than most other middle tropospheric data records constructed from the same set of satellites."
This comment has been removed by the author.
DeleteI would suspect the WUWT will be dead silent - pretend it isnt happening unless someone can come up with a good conspiracy theory.
DeleteWUWT is working on throwing Dr Carl Mears under a bus. Dr Spencer and Dr Christy next.
DeleteI expect the goalposts to get lifted and shifted. Any bets as to where?
ReplyDeleteExpect a new episode from Monckton: "The pause continues - no warming since a week last Tuesday"
DeleteGoing up the ladder of Denial: next stop; Bjorn Lomborg - warming's happened before / it's no big deal / too expensive to do anything about / we should be ensuring The Poors (who we luv, treally ruly) can invest in catastrophe-proof condominiums instead using money they've saved deploying cheap, nourishing coal-power...
DeleteThen when 2017 proves cooler revert to the Ice Age is Coming!
It's only the el nino.
DeleteThere's been almost no warming since 1979.
The warming isn't statistically significant.
The warming isn't as much as predicted in 1990.
There's no such thing as an average temperature.
Oh and - Osama Bin Laden.
DeleteBellman, I think you have the right of it. One or more of those excuses will become the new meme -- plus,
DeleteWait for La Nina
2017 will be cooler -- Recovery!
Weather is always random ups and downs
The data is all fraudulent
"The data is all fraudulent"
DeleteYou obviously cannot trust satellite data, as they keep adjusting it.
This comment has been removed by the author.
DeleteThe UAH data has now been posted on WUWT, and richardscourtney has an excuse I hadn't thought of - global temperatures vary by 3.8C a year, which is equivalent to 760C a century - so why worry about a 1 degree rise.
DeleteBy this logic temperatures could rise by 100C and it wouldn't be a problem.
Time for Ted to call another Senate inquiry into temperature data. Orrr maybe not.
ReplyDeleteBut what will be the new "hold standard" for measuring temperature? Where do they go after the satellites have let them down?
ReplyDeleteGold standard! Damn you, auto correct:)
DeleteOh you beat me to it. dbstealey's gold standard has betrayed him.
DeleteAnswer: anywhere where lack of data or faulty data allows them to construct their next castle in the air.
Or I suppose Jim Inhofe could find another snowball.
DeleteOh well, it has happened. The surface record released later this month will be interesting.
ReplyDeleteI think Dr Roy Spencer is right, there has been a bigger one-month jump in the UAH record. But such a big jump after an already-warm month?
Both the UAH and RSS websites are having caching issues - a coincidence surely?
ReplyDeleteAll good now.
DeleteThey will simply default back to "it's a conspiracy"
ReplyDeleteIt needs no explanatory powers, no evidence - in fact the very lack of evidence (of a conspiracy) is evidence in itself
And the more actual evidence of AGW is discovered the more obvious "it is a conspiracy"
"News of the record hot February hasn't hit WUWT yet, so there are no "thoughts" to ponder."
ReplyDeleteFact based information from the reality based universe never ever reaches the North Korea of the blogoshere and Willard Watt's moronic minions will continue spewing their outrageous outrage towards scientists.
The former radio weatherman and college dropout was busy late last week with his latest imagined scandal from the Wingnut Alternate Reality (WAR for short), for which Neven coined the phrase DMIgate.
Watts went on a banning spree, removing comments containing inconvenient truth, as well as comments referring to these actual facts. Nobody is better at digging holes than the intellectual lightweight and things became so strange Neven felt it necessary to bring this bizarre tale to light.
http://bit.ly/1RGhED5
Jim Hunt and "Snow White" have excellent coverage of the imagined scandal. A "food fight" broke out at Judith Curry's blog. Names were hijacked,Curry went to the aid of Willard who showed up to defend his honour and lie through his teeth. Curry then deleted rebuttals to Watt's fetid troll droppings. Meanwhile back at the pseudo-science blog, Willard reposted some but not all of the comments that vanished without a trace down the memory hole at WUWT. Jim Hunt's blog Great White Con has excellent coverage of this faux scandal. No need to fear, copies were archived before and after in this scandal Reggie is going to call Snip-gate. Watt's has certainly not heard the last of this from me, he has been caught in the act altering the timeline at his blog and we have the proof.
The “DMIGate” Dodo is Pushing up the Daisies | The Great White Con
http://bit.ly/24AT5Pc
Gross Deception About MASIE and the Sea Ice Index | The Great White Con
http://bit.ly/1QT9TNk
This comment at the Great White Con contains a brief summary of Willard's weird August in 2002.It is very relevant because it marked the beginning of Steve Mosher's fall from grace at WUWT. Mosher posted less than flattering comments at Curry's regarding moderation at the cesspool Watt's calls a blog.
Deletehttp://bit.ly/1oYm4fq
Surely the next statement (on the downslope of el-Niño will be "biggest fall in temperature for 18 years" prepare for ice age.
ReplyDeleteA heads up about a new (warmer) version of RSS thanks to Gavin Schmidt.
ReplyDeleteI'll write about it shortly.
I'm anxious to hear about the new RSS version. I wonder if Monckton's faux pause will turn out to never have been at all.
DeleteWUWTers most likely will drop RSS into the conspiracy pile.
The faux pas has always been faux as it depends on a complete misuse of statistics. Talking as if it ever existed statistically is an inferential error. Pure and simple.
DeleteThere have certainly been cycles in the climate record. But pauses in the last half century or more? No.
There may even be some explainable variation yet to pin down in the cycles though some is surely just plain unpredictable error. But cycles, BY DEFINITION, do NOT affect a trend, they balance out to zero over time. Deciding whether a "pattern" is real or not real is the job of statistics. There is not now nor has there ever been any statistical evidence for a "pause" recently.
Tamino has a preview:
Deletehttps://tamino.wordpress.com/2016/03/02/new-dataset-from-rss-end-of-the-satellite-pause/
So does HW, BBD :)
DeleteThe mid-troposphere has been warming faster than you thought
Of course it does :-)
DeleteThanks, Sou.
There goes the pause! Talking point killed.
ReplyDeletePachauri has been charged. I guess that's a much needed squirrel for the WUWTers.
ReplyDeleteThere goes the pause! Talking point killed.
ReplyDeleteThe February RSS data is now available, so I've added an ENSO tracking chart to the above as an update. It's another "hottest ever".
ReplyDelete