The readers at WUWT have put in their sea ice prediction to arcus.org at 6.11 million square kilometres average for the month of September. (Archived here.)
Here it is compared to previous September averages, I've put in a red line to show the WUWT prediction. Click to enlarge:
 |
| Adapted from arcus.org |
Anthony applied a weighted average to the top five most popular predictions. WUWT-ers think the average ice extent will be the same as it was around ten years ago, in 2004.
Here are the averages for the month of September going back to 2006 (the archives didn't go back any further), from NSIDC:
- 2006 5.9 million square kilometers
- 2007 4.28 million square kilometers
- 2008 4.67 million square kilometers
- 2009 5.36 million square kilometers
- 2010 4.90 million square kilometers
- 2011 4.61 million square kilometers
- 2012 3.61 million square kilometers
- 2013 5.35 million square kilometers
- 2014? 6.11 million square kilometers? (WUWT prediction)
I myself won't take a guess. The Arctic is too fickle and I'm not an expert. Here's the latest chart from NSIDC. Click the image to view larger:
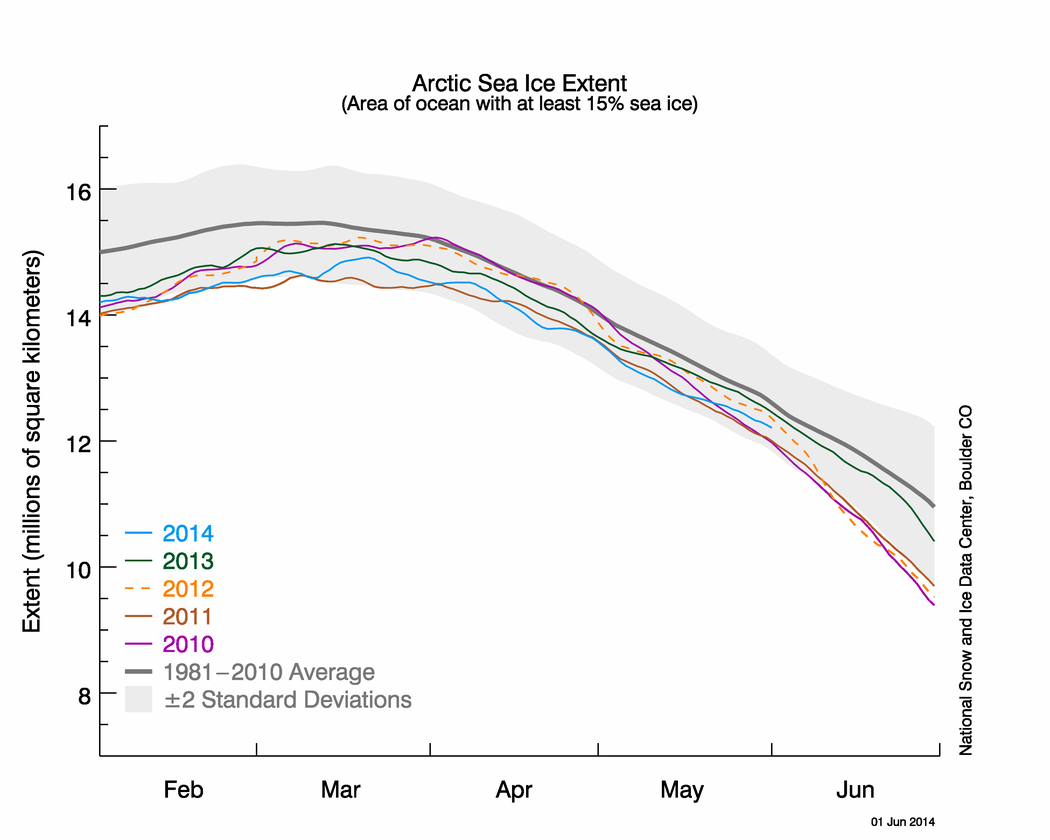 |
| The graph above shows Arctic sea ice extent as of June 1, 2014, along with daily ice extent data for four previous years. 2014 is shown in blue, 2013 in green, 2012 in orange, 2011 in brown, and 2010 in purple. The 1981 to 2010 average is in dark gray. Sea Ice Index data. Source: NSIDC |
I came across a recent paper in Nature Climate Change by David Schröder, Daniel L. Feltham, Daniela Flocco & Michel Tsamados. The authors reckon they've come up with a better approach to predictions - look at the melt-pond area in the spring. The abstract says in part:
...here we show that the Arctic sea-ice minimum can be accurately forecasted from melt-pond area in spring. We find a strong correlation between the spring pond fraction and September sea-ice extent. This is explained by a positive feedback mechanism: more ponds reduce the albedo; a lower albedo causes more melting; more melting increases pond fraction. Our results help explain the acceleration of Arctic sea-ice decrease during the past decade. The inclusion of our new melt-pond model promises to improve the skill of future forecast and climate models in Arctic regions and beyond.
If you want to keep up with the latest in the Arctic, I recommend Neven's Arctic Sea Ice blog.
From the WUWT comments
william's contribution must be a Poe, he says he saw a NOAA documentary called "The Day After Tomorrow":
June 10, 2014 at 9:12 am
Whatever the extent, all of the Polar bears will be drowned and life on our planet will cease when the atlantic conveyor stops and North American temperatures drop to 100 degrees below zero. I saw a documentary put out by NOAA called “The Day After Tomorrow”. Thank goodness our president is going to shut down all the coal plants so that all those people dont freeze to death. There are not enough books to burn to stay warm through something like that!
Jim Hunt offers some good information about Arctic sea ice, but Anthony will have none of it. It's too sciency for Anthony who says that Arctic ice extent has nothing to do with volume:
June 10, 2014 at 9:32 am
Re: @Anthony says: June 10, 2014 at 8:55 am
It’s not my “own views” Anthony. In fact it’s a long list of useful facts and figures for anybody attempting to forecast the future of Arctic sea ice. A long list of useful information still noticeable only by its absence from the WUWT sea ice reference page.
REPLY: We aren’t forecasting volume, we are forecasting extent, so again, your views that we should pay attention to volume graphs on your website (your favorite hobby horse) in this extent forecasting exercise are irrelevant. Don’t clutter up this thread further – Anthony
Anthony really doesn't like scientific comments, it upsets his denier audience. He prefers comments like this one, from Joe Bastardi, award-winning meteorologist and greenhouse effect denier. Joseph Bastardi says (excerpt):
June 10, 2014 at 8:49 am
...One thing is certain. even if it gets NEAR NORMAL given what its been the past 10-15 years since the warm amo really took hold, we can safely say that co2 has nothing to do with this. ...
dbstealey is a Little Ice Age bouncer who keeps contradicting himself trying to cover too many bases while still denying human-caused global warming, and says:
June 10, 2014 at 9:38 am
As we see here, the planet is still recovering from the Little Ice Age. Naturally polar ice is going to decline.
Notice that in the [natural] global warming since the LIA, the trend has remained within its long term parameters. Despite all the alarmist predictions, there has been no acceleration in global warming [in fact, GW has stopped].
If polar ice declines, so what? As with rising CO2, that would be a net benefit: much shorter transit times for shipping, with much reduced fuel costs, an open northwest passage, less need for icebreakers, etc.
The only reason polar ice is discussed is because of the endless predictions that Arctic ice would soon disappear. The alarmist crowd is desperately hoping that it does. But so what if it does? It’s all good… and it’s all natural.
ripshin says it's cold in Virginia so there'll be a lot of ice in the Arctic in September:
June 10, 2014 at 10:18 am
June feels a lot cooler here in central Virginia than it used to…so I’m going with more ice: 7.75 MsqKM. “Today, I go for the gusto.”
rip
Steven Mosher linked to some charts (see third one down for different projections), but Anthony doesn't want to acknowledge the disappearance of Arctic sea ice:
June 10, 2014 at 11:20 am
https://sites.google.com/site/pettitclimategraphs/sea-ice-extent
REPLY:IMHO, any graph that uses “death spiral” as part of the description should be ignored – Anthony
Schröder, David, Daniel L. Feltham, Daniela Flocco, and Michel Tsamados. "September Arctic sea-ice minimum predicted by spring melt-pond fraction." Nature Climate Change (2014). doi:10.1038/nclimate2203
Thanks for the mention Sou.
ReplyDeleteWhen I have a spare 5 minutes I'll be writing an article of my own on my recent experience of "mud wrestling" at WUWT. In the meantime here's a precis:
http://forum.arctic-sea-ice.net/index.php/topic,578.msg28128.html#msg28128
and here's what Watts doesn't want his loyal followers to see:
http://GreatWhiteCon.info/resources/arctic-sea-ice-graphs/
Of course this latest tomfoolery from WUWT is in sync' with the tomfoolery from William de Lange and Bob Carter that the Arctic has been cooling strongly for the last fifty years.
ReplyDeletede Lange & Carter are of course also linked with the, Tol aligned, GWPF and that infamous NIPCC report which Gareth at Hot Topic has been studying.
and then there's this pic: http://www.skepticalscience.com/pics/1_Overall_SEARCH.jpg
ReplyDelete(noticed which prediction missed the most last year :) )
from this page: http://www.skepticalscience.com/2013-arctic-sea-ice-prediction.html
To call the WUWT estimate a prediction is stretching it a bit. As far as I can tell the number was obtained by a poll of WUWT voters making a guess. So it is predicting sea ice by consensus. Quite surprising given WUWT's known antipathy to consensus.
ReplyDeleteGood comment! They stay firmly -consensually- oblivious of the idiocy of their engagement with the ghastly Mr Watts.
DeleteTo call the WUWT estimate a prediction is stretching it a bit.
It's more like a plea than a prediction..
There was a single year spike in 1996 and 2013. Rare enough, but they are saying 2014 will spike even higher. Never has the ice done that in 35 years of record, so *facepalm*
ReplyDeleteha they've predicted far too high again. how predictable.
They are basically predicting an event that's never occurred in the 35 years of record. That's pretty stupid to have predicted such a thing.
You can be pretty confident it won't get anywhere near as high as they've predicted. Odds are far lower than last year.
35 years isn't all that long, and it's 35 years that are atypical compared to the previous several millennia (and likely longer). I'm not going to put too much stock in arguments of the form "hasn't happened in the record so it can't happen".
DeleteThat said, "it's on WUWT so it's very likely completely bullshit" is an argument that pretty much convinces me.
The Wattsupians are notorious for doing "'science' by ideology" (nested scare quotes. A first for me). It's like betting heavily on Honduras to win the World Cup. Because you're from Honduras, so you just *know* they can do it.
Delete35 years is long enough for me. On the face of that I give them less than 1/35 odds. They've only gone with it because of their "return to the LIA" fantasy. Can't let them get away with making such stupid bet. Come September it's very likely I will be saying to them "nah nah told you so" but I can only do that if I come out now scorning their bet.
DeleteWith a satellite record of 35 years of stunning decline, I pretty much expect the unexpected. In that record that we've had a year with so much decline that no subsequent year even matched any preceding year. Seems preposterous to predict such a thing in such a noisy system, yet it happened. Based just on the record, I don't see a particularly good reason to say that two subsequent years of increase is impossible. I need to take in some knowledge about the physics to agree. Based on physics, I think it is approximately equally likely that pigs can achieve stable flight and that the ice extent will be anywhere near the 30-year average this year.
DeleteCome September, silence; come November, 'spectacular recovery'.
DeleteOr forget it, there's another hemisphere handy now.
I look forward to "Just The Facts" (which must be his real name -- we know how much Watts hates pseudonyms) writing about the mystery of what ever could be making the ice melt? And also maybe presenting a graph of annual ice rebound, which shows the rebound increasing over time.
DeleteAnthony Watts assures me via Twitter that "You have only your own self and commenting style to blame". Needless to say I beg to differ:
ReplyDeletehttp://GreatWhiteCon.info/2014/06/forecasting-sea-ice-extent-in-the-dark/
I hope that at the very least all and sundry will find the "Gish Gallop in 72 seconds" video useful!
"You have only your own self and commenting style to blame".
DeleteFor Willard, being inclined to rely on scientific rationality, and possessing a commenting style that employs reference to the best science, is "to blame".
Quite so Bernard.
DeleteAs I pointed out to one "Caleb@WUWT", who has still to approve my comment on his own blog:
"Just for the record, I confidently predict that 'A value of 6.12 million sq km' will ultimately prove to be an over estimate!"