There's a new chap he's picked up from somewhere called Jeffery S. Patterson, who enjoys playing with numbers. I'm not terribly interested in his numbers. What interests me is the way his numbers take him away from reality.
Jeffery gets a lot wrong
In the midst of today's article (archived here) he writes a few very odd things:
The linear trend in slope evident in Figure 1a implies a parabolic temperature trend. The IPCC makes oblique reference to this in the recently releases AR-5 Summary for Policymakers:First up, I see nothing in his quote from the IPCC that is an oblique or otherwise reference to a parabolic temperature trend. All I read is that it's been getting hotter lately.
“Each of the last three decades has been successively warmer at the Earth’s surface than any preceding decade since 1850 (see Figure SPM.1). In the Northern Hemisphere, 1983–2012 was likely the warmest 30-year period of the last 1400 years (medium confidence).”True enough, but that has been true since at least the mid-1800s. The implication of the IPCC’s ominous statement is that anthropogenic effects on the climate have been present since that early time. Let’s examine that hypothesis.
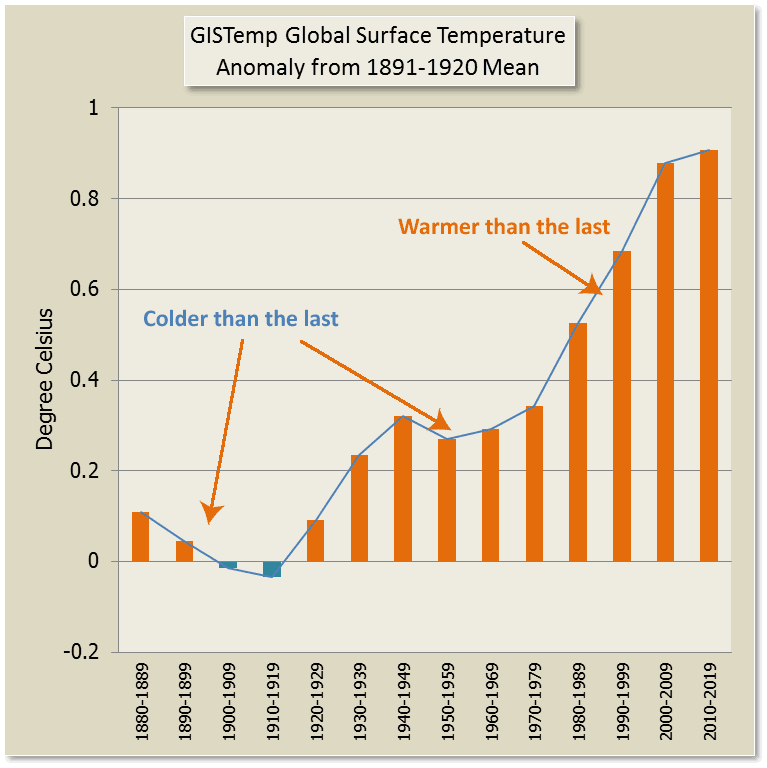
Secondly, the earth hasn't had each decade since the mid-1800s successively warmer than the last. Nor has each decade since the mid-1800s been the warmest in the last 1400 years. In fact, the early part of the twentieth century was a bit chilly - at least in comparison to now.
Here's a chart showing decadal temperatures and how the last three full decades (1971-80 to 2000-09), plus the current one so far, have been warmer than all those before them in the record. The decades from 1920 to 1949 were also successively warmer followed by two cooler decades.:
 |
| Data Source: NASA |
Talking of the last 1400 years, here's a chart, Box TS.5, Figure 1 from the AR5 WG1 Technical Summary (page TS-103) for the Northern Hemisphere, going back around 1200 years. The top chart is radiative forcing and the bottom chart is reconstructed and simulated NH temperature anomaly from a baseline of the average from 1500 to 1850. Click to see it larger.
Jeffery seems to have adopted a narrative of the type that surface temperature can rise all by itself, given an initial prod, even though that prod is not sustained. He is a science denier who looks to mathturbation to disprove human induced global warming. But what he writes isn't supported by the data. Here is how he finishes his article:
Jeffery is a bit weird with his "integral second-order response to a triggering event" - that doesn't seem to have had any lasting effect and that couldn't have been caused by the sun. All he did was remove the rising trend and then looked at the data with the trend removed and said that there's no anthropogenic signal. He's not the first to try that trick on one pretext or other. John McLean, Bob Carter and Chris de Freitas tried that one on a few years ago and were picked up quick smart!
 |
| Data Source: IPCC AR5 WG1 - Box TS.5, Figure 1 (page TS-103) |
Jeffery later writes:
Jeffery mentioned the high temperature in 1878. In fact that's what he's called his article: The Great Climate Shift of 1878. Except there wasn't!
There was a big spike in the HadCRUT temperature record in 1878 as the chart below shows, but the "shift in the climate" (as indicated by surface temperature) didn't start in earnest until the early twentieth century:
Around the year 1878, a dramatic shift in the climate occurred coincident with and perhaps triggered by an impulsive spike in temperature. As a result, the climate moved from a cooling phase of about -.7 °C/century to a warming phase of about +.5°C/century, which has remained constant to the present. We see that this period of time was coincident with a large spike in solar activity as shown in figure 7.As far as his "cooling phase of about -0.7°C/century" goes, he doesn't use data prior to 1850 so how on earth he can say that with a straight face I don't know. Even had he gone back in time he'd have been way off beam. The earth did cool for about 5,000 years after the Holocene optimum, but it was at nothing like -0.7°C/century. That amount of cooling would have taken us into a very deep ice age had it gone on for 50 centuries!
Jeffery mentioned the high temperature in 1878. In fact that's what he's called his article: The Great Climate Shift of 1878. Except there wasn't!
There was a big spike in the HadCRUT temperature record in 1878 as the chart below shows, but the "shift in the climate" (as indicated by surface temperature) didn't start in earnest until the early twentieth century:
 |
| Data Source: HadCRU |
Below is the radiative forcing chart blown up. The top is volcanic forcing, the middle is total solar irradiance (TSI) and down the bottom are well-mixed greenhouse gases (WMGHGs). There is no sign of a spike of any type in 1878. TSI went up in the twentieth century and there were a couple of large-ish volcanoes early in the 19th century but that's about it.
 |
| Data Source: IPCC AR5 WG1 - Box TS.5, Figure 1 (page TS-103) |
Jeffery seems to have adopted a narrative of the type that surface temperature can rise all by itself, given an initial prod, even though that prod is not sustained. He is a science denier who looks to mathturbation to disprove human induced global warming. But what he writes isn't supported by the data. Here is how he finishes his article:
The climate record of the past 163 years is well explained as the integral second-order response to a triggering event that occurred in the mid-to-late 1870s, plus an oscillatory mode regulated by solar irradiance. There is no evidence in the temperature records analyzed here supporting the hypothesis that mankind has had a measurable effect on the global climate.
Jeffery is a bit weird with his "integral second-order response to a triggering event" - that doesn't seem to have had any lasting effect and that couldn't have been caused by the sun. All he did was remove the rising trend and then looked at the data with the trend removed and said that there's no anthropogenic signal. He's not the first to try that trick on one pretext or other. John McLean, Bob Carter and Chris de Freitas tried that one on a few years ago and were picked up quick smart!
"Beggars can't be choosers and Anthony couldn't write a decent article all by himself if you paid him. He relies on guest articles to keep his blog alive."
ReplyDeleteNot that the guest articles are especially decent either. Tony gets help to keep up the quantity, not the quality.
Jeffrey's article is a bit dull but for an actual scientific discussion of the 1878 event see www.dgf.uchile.cl/ACT19/COMUNICACIONES/Revistas/aceetal08.pdf
ReplyDeleteAs is usually the case fact is more interesting than fancy.
Thanks, Don. That paper has some good detailed descriptions.
DeleteYou might want to consult an elementary Calculus text to learn the difference between the instantaneous slope and the linear trend. I know it confusing because the have the same units but learning that distinction might save you future embarrassment. Oh, and BTW, the system response equation you laughed off when driven by only the annual sunspot number matches the observed temperature record with R=.96 and backcasts to 1750 within the uncertainty band of the BEST reconstruction. See http://wp.me/p2xhN5-4C
ReplyDeleteJeff, are you also claiming that it's lack of pirates that's causing global warming?
Deletehttp://en.wikipedia.org/wiki/Flying_Spaghetti_Monster#Pirates_and_global_warming
And you're wrong to say that "Each of the last three decades has been successively warmer"... has been true since at least the mid-1800s. Not true - on any level!
Whereas "anthropogenic effects on the climate have been present since that early time" (1800s) is true.
Numbers can be fun but make no sense without the science.
Uh, if one can convolve an input function (SSN) with a proposed system impulse response and produce the measured output (R=.96) (and backcast it 100 years), then one has definitively defined the system. Correlation does not imply causation. Input @ Impulse response = Output does.
DeleteSure, Jeff. Whatever you say - which was, IIRC, the climate shifted in 1878 caused by a sudden rise in surface temperature! Magic 101.
DeleteAnd the temperature is now going up at "constant rate" of 0.5 degrees a century caused by more magic, sorry, I meant to say it's going up caused by a rise in temperature in 1878.
Plus the sunspot numbers you dug up from somewhere, that don't accord with solar irradiance, to add some wiggles I guess.
A rise in global surface temperature is caused by a rise in temperature plus wiggles. That is so profound I'm amazed that all the scientists don't just pack up their bags and go home.
I should heed Heinlein's sage advice re teaching pigs to sing but I'll try once more. A second order system contains two integrators. Thus it is the asymmetry in the TSI cycles over time, not the short term peak to peak amplitudes of each cycle that determines the current temperature. When the SSN record is passed through the system response, it creates not just the wiggles, but reproduces the SST record with great fidelity. The GCMs can't come close to the correlation this model achieves, and no handwaving about missing heat or volcanoes required.
ReplyDeleteSorry Jeff. Like I said, the pattern might be there but unless you can explain it using science it means diddly squat.
DeleteLots of people before you have done mathematical fits to the data. Only the ones that are accompanied by an explanation of the mechanism have any value at all. Yours doesn't. Come back after you've figured out the "why".
Jeff, when/if you come up with a scientific explanation for your mathematical fit, if it doesn't include the increase in greenhouse gases you will need to explain why they've suddenly stopped working. Or else explain what is the negative forcing that is overwhelming the positive forcing of the huge increase in greenhouse gases.
DeleteOtherwise, you'll just be left with mathturbation. Which would be a shame, because it's a pretty pattern.
"I remember my friend Johnny von Neumann used to say, 'with four parameters I can fit an elephant and with five I can make him wiggle his trunk.'" A meeting with Enrico Fermi, Nature 427, 297; 2004.
ReplyDeleteJeff has what, five parameters? (6 on his blog) Wiggle away...
BTW, what physical phenomena do all 5(or 6) parameters correlate to?
Why were Leif and Sou quickly able to show Jeff's solar data to be off so easily?
How would Jeff's "cycles" look if aerosols weren't legislated away in the 70's?
Triggering event - really? Conservation of energy is violated in Jeff's mind, only. And that "triggering event" caused a decline first - why? then an incline? News Flash to Jeff and Bob Tisdale - El Ninos do not create energy because energy cannot be created nor destroyed.
AGW models produce increasing temperature anomalies not because they have "triggering events" that violate the conservation of energy but because GHGs retain more energy within the climate system.
I can't believe I wasted my time making a comment on this nonsense. I guess the good news is that it wasn't another UHI discussion because Jeff accepts the earth has been warming.
Exactly. The only explanation Jeff's provided is some "dramatic shift in the climate in 1878" plus sunspots. The 1878 El Nino is described in the paper Don Brook provided but the temperature record shows it as a one off, not the start of any trend.
DeleteSo Jeff's "dramatic shift" must have been caused by magic, because there is no such change in the forcings at that time either, as the chart in my article above illustrates. Nor can the recent rise in temperature be explained by TSI changes. So Jeff's hypothesis is all wrong from start to end. All he's left with is a mathematical fit.