Today he's written a short piece (archived here). What he has called a Quote of the Week. It's not a bad quote I suppose, but there's no reason for a denier to pull it out as a quote of the week unless they are a hard core denier.
Now I've said before that when Anthony Watts decides to write something himself, he usually gets things dreadfully wrong. Today is no exception. He's done a doozy. And he's proven that he does read some of what he posts. He must have read some Denier Don Easterbrook. Or maybe this is a homage to Don.
First the quote. It's in two parts, with some commentary by Anthony before, in between, and after:
While ramping up his own invective to fit as much ad hominem as possible into a single sentence:
“Mr. Sauer parroted baseless talking points that have their origin in fossil-fuel industry-funded climate change denial propaganda, not honest scientific discourse.
Michael Mann says:
“overall warmth of the globe and northern hemisphere today is substantially greater than during Medieval time”
Source: http://www.theunion.com/opinion/columns/18308425-113/michael-mann-columnist-peddles-discredited-fossil-fuel-industry
Then the article - Professor Mann was writing about a hit piece from someone called Norm Sauer, who wrongly accused Dr Mann of fraud and fakery and more. (If you must read it, follow the link from Michael Mann's article above.) It was, as Michael Mann said, nothing but baseless talking points, a parroting of the worst denier memes about. I don't think there was an accurate sentence in among the entire opinion piece. And it was so yesterday. So old hat. And Michael Mann was right to respond.
Anthony claims Greenland is the whole world - and gets even more wrong
Anthony Watts did a Denier Don Easterbrook in response, and put up a wrong chart of temperatures in Greenland, which he claimed showed that there was global warming in Medieval times and that it was hotter than today. How nutty is that? This is what Anthony wrote:
Except, there’s that pesky ice core proxy temperature data (proxy temperature data is something Mann embraces for his own Hockey Stick) that says otherwise:Anthony is way wrong. The ice core proxy temperature chart that he put up shows that Michael Mann is right and Anthony is wrong. The temperature on the top of the ice sheet in Central Greenland is higher today than it was in Medieval times.
Let's see what is wrong with Anthony's picture - click to enlarge it:
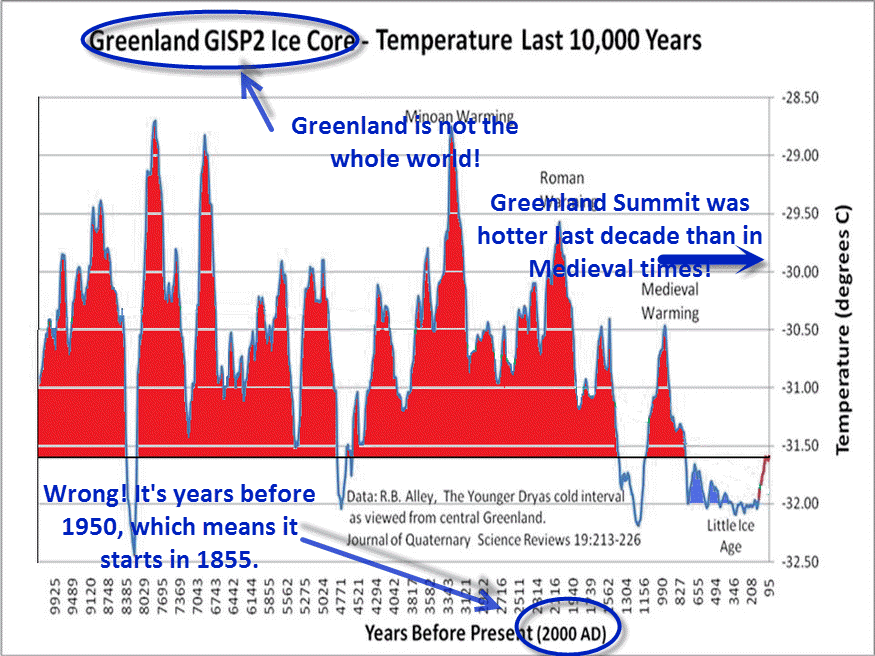
- First of all, Greenland is not the whole world. Anthony is wrong about that. So his chart cannot prove Anthony's "otherwise".
- Secondly, his chart starts in 1855, so it doesn't show the present. Meaning it cannot prove Anthony's "otherwise".
- Thirdly, I've added the average temperature for the decade ending in 2010. It's probably even higher today. So even if the chart is corrected, it disproves Anthony's "otherwise".
I think Anthony is going ga-ga. The heat is addling his brain. He is behaving like one of the more extreme deniers at WUWT. It's not as if he doesn't know the chart he used is wrong. It's not as if he doesn't know that Greenland isn't the whole world.
Anthony Watts vs Anthony Watts
Thing is, his chart is listed on his very own WUWT paleoclimate page under the section headed "disputed/incorrect graphs" and it's described as wrong:
10,000 Years – Incorrect Graph – GISP2 – Alley, 2000 The x axis label, “Years Before Present (2000 AD)”, should read Years Before Present (1950 AD)
Yes, that's right. On Anthony's own website he's got his supposed good chart listed not just as disputed, not just as falsified [corrected label, Sou], but it has acknowledged that the labelling is wrong!
The Medieval Warm Period was 11,500 years ago?
It gets worse, if possible. Apparently a reader quizzed him on the chart. So Anthony posted a big slab of quite irrelevant information. He added something about The Younger Dryas cold interval, that there were "Near-simultaneous changes in ice-core paleoclimatic indicators of local, regional, and more-widespread climate conditions demonstrate that much of the Earth experienced abrupt climate changes synchronous with Greenland within thirty years or less."
Anthony didn't link to the full paper, only to the abstract. So I will. Here is when that period ended, from the paper itself:
Recent estimates of the age of the Younger Dryas termination, including those of Hughen et al. (1998) and Gulliksen et al. (1998), and those summarized by Alley et al. (1997b), indicate an age close to 11,500 yr before 1950.
Here is Anthony's chart with the Younger Dryas cold interval marked. It's nowhere near medieval times. Click to enlarge the chart:

In fact, it's off the chart. It's not even shown on his chart - it's way off to the left hand side.
From the WUWT comments
If Anthony ever had any sensible readers, they've been leaving him in droves. Have a gander at the comments. Anthony deserves them.
firetoice2014 comes up with denier drivel:
September 23, 2015 at 4:05 pm
Mann appears hell-bent on making himself a laughingstock, with or without the help of Mark Steyn.
J. Philip Peterson wants to know how to estimate temperature from ice cores. Well I don't have time to educate him today. I've written about this sometime or other.
September 23, 2015 at 4:11 pm
Once again, how can you measure temperature for 800 years, 1000 years, 3000 years from an ice core?
As a layman, I don’t understand. The Vikings didn’t have thermometers…please explain how it is done from an ice core?
Aran points out that Anthony's article is nonsense:
September 23, 2015 at 4:18 pm
The graph shown is not a refutation of Mann’s words, since firstly it concerns local temperatures rather than overall temperatures, but more importantly, it ends at 95 years before present, which would either be 1905 or 1855 depending on who you believe. Either way, it is not valid as an argument in a discussion about temperatures today.
M Courtney doesn't believe you can compare past temperatures to present temperatures. I mean literally. He thinks it's not permitted. Is he for real?
September 23, 2015 at 4:27 pm
Nor would splicing current temperature records onto a proxy be valid as an argument in a discussion about the MWP.
You’re right that that would be like Mann’s Nature trick.
But it’s not a legitimate technique that would be used by honest or competent scientists.
Anthony Watts doubles down on his mistakes, and swears that the caption is correct. It's not and he knows it's not. He's been told lots and lots of times at WUWT that the "present" is 1950, as is convention.
September 23, 2015 at 5:04 pmAnd then he posts his slab about temperatures of 11,500 years ago, as if they've got anything to do with temperatures of 1,000 years ago!
Note the caption, it is to the year 2000, the scale is not indicating an endpoint at 95. Note also that the data and graph is from Richard B. Alley, of Penn State, a colleague of Mann.
Nick Stokes weighs in:
September 23, 2015 at 5:19 pm
Aran is absolutely right. The Allen GISP data, as has been pointed out endlessly at WUWT, ends in 1855. Here is none other than AW at WUWT in 2009:
“The ice core data from Greenland doesn’t go past the year 1900”
But BP means before 1950.
Anthony then put up a dinky chart of unknown provenance, which no doubt displeased M Courtney, because someone had spliced what they claimed were current temperatures on GISP2, but weren't. It stopped at minus 31°C, whereas Kobashi et al (2011) reports the temperature of the decade to 2010 as "The current decadal average surface temperature (2001–2010) at the GISP2 site is −29.9°C", which is considerably warmer than it was in medieval times. So Anthony fails again.
References and further reading
Alley, Richard B. "The Younger Dryas cold interval as viewed from central Greenland." Quaternary science reviews 19, no. 1 (2000): 213-226. doi:10.1016/S0277-3791(99)00062-1 (pdf here)
Kobashi, Takuro, Kenji Kawamura, Jeffrey P. Severinghaus, Jean‐Marc Barnola, Toshiyuki Nakaegawa, Bo M. Vinther, Sigfús J., and Jason E. Box. "High variability of Greenland surface temperature over the past 4000 years estimated from trapped air in an ice core." Geophysical Research Letters 38, no. 21 (2011). DOI: 10.1029/2011GL049444 (open access)
I've got to go. You can search for Don Easterbrook and Greenland above to see what I mean by the comparison. Here's a couple of relevant links:
- Denier Don is Angry - HotWhopper
- 1934 and other treasured legends of climate science deniers - including the MWP (HotWhopper)
- Easterbrook's Wrong (Again) - by Gareth Renowden at Hot Topic NZ (from 2011)
Yep, I suggested that Mann should add Tony as a codefendent in his lawsuit.
ReplyDeleteFull story of that graph here: http://hot-topic.co.nz/easterbrooks-wrong-again/
ReplyDeleteThanks, Gareth. That's an excellent article. I've added a link to it up above now.
DeleteOne might wonder why Tony doesn't show any global reconstruction, like the PAGES 2K one from two years ago. And that applies to many other "skeptics" as well: why do they always show data for only the Central Greenland summit, and not the globe? It is a mystery.
ReplyDeleteThe same incomprehensible mystery may explain why they like to show temperature estimates for the upper tropical troposphere and pretend it is the global surface temperature.
DeleteCherry-picking, pure and simple. Showing the global temperature does not fit their narrative, so they ignore it.
DeleteI have pointed out the fallacy of that graphic many times on WUWT with response by the moderators, they even explained my position. I linked the source data with reference to the definition of "BP".
ReplyDeleteTo continue to reuse this graphic is nothing short of gross deception and should bring into focus the abhorrent, sociopathic nature of these climate denialist portals, with their >$100 million dollars of funding from fossil fuel suppliers over the last decade. Their wont is to make money, plain and simple, they have NO regard for the poor, the sick and those who will suffer early mortality due to resource wars, heat waves, illness and extreme weather impacts over the coming decades.
Ah, but you obviously didn't get the memo. Nowadays the meme is that the poor will never rise out of poverty without that wonderful fossil fuel energy -- cheap, abundant, and it makes plant food too!
DeleteOf course, most of these folks never gave two hoots about the poor of the world, until they could be used as pawns in their argument.
It's darkly hilarious.
Yep. I've always found this line pretty funny, but they've been using it for a decade or so. I first saw Christy use it in Congressional testimony during the episodes which led to the Wegman report being commissioned. There is nothing new with these guys, it's all recycled.
DeleteThe libtards said that the poor, the sick and the vulnerable would suffer most. You do not have to pay social Darwinists to be against that; they love it. They would gladly pay money and are willing to make America suffer to make that social Darwinian paradise happen.
DeleteM Courtney sez:
ReplyDeleteNor would splicing current temperature records onto a proxy be valid as an argument in a discussion about the MWP.
Since the ice core doesn't start until 1855 (because the top good few metres of any ice sheet is 'firn', uncompacted snow/melt which hasn't formed part of the ice core yet), what proxy data does M Courtney propose we use? Same with ocean and lake sediments. The top hasn't settled yet. That's why we have to use the temperature record.
But, it's not like you can expect AGW deniers to know this kind of basic stuff. If they did, they wouldn't be in denial. Oh, wait...
A similar graph, which does get the dates right was presented as a comment in the local paper. The original image can be found here:
ReplyDeletehttp://i.snag.gy/BztF1.jpg
What is curious is that the maker had grafted the 'hockey stick' onto it without realizing that the last datapoint still was 10pxl or 80 years from the year 2000.
As a quick fix, I corrected the graph using the AWS-data from CIRES (South dome station from here: http://cires1.colorado.edu/science/groups/steffen/gcnet/order/admin/station.php), and made this:
http://i.imgur.com/6dSIOIZ.png
Poltsi
For the global Holocene, you need Marcott et al. (2013) Fig. 1 b (some added text).
ReplyDeleteThe contrarians raised an almighty howl over that study, IIRC ;-) (How many posts at WUWT and CA was it again, Sou? I remember you keeping tally but I lost count eventually).
The trouble was, despite all the frenzied denial and misrepresentation, there was nothing wrong with M13, was there?
And the reconstruction is rather different from what was happening on top of the Greenland ice sheet (eg. GISP2), which just goes to show that the GrIS isn't a proxy for global temperature after all :-)
Watts has referred to this post now and its graph, still acting as if he doesn't know how misleading it is. And he has added more evidence: proxy data from the Pyrenees!
ReplyDeleteAmazing how people keep falling for this sh*t...
Anthony is really scared of Michael Mann, which is why he has it in for him.
DeleteRemember when Anthony got his WUWT fans to pay for him to go all the way from California to the UK, just so he could ask Dr Mann some questions. Then he piked and didn't even put up his hand.
When he finally got back home and was safely behind his computer, he posted something stupid on Mike's facebook page. That was just so he could tell his fans that Michael Mann refused to answer the questions he didn't ask.
This time he is claiming that it's Michael Mann using invective, when it's the person Michael is responding to who accused Prof Mann of fraud and fakery.
Anthony is bad most of the time but he's worse than bad when he attacks scientists.
Re his latest dismal effort claiming that Spain is the whole world. I wonder if Anthony knows what an isotope is? What's the bet he doesn't :)
I wonder does he know that the charts in the paper he put up show the period around 1000 years ago (Anthony's "Medieval Warm Period") was almost as cold as it was around 1900. And does he know that Esper wrote:
"The Spanish Pyrenees δ13C based reconstruction presented here shows warmer and more variable growing season temperatures during the Little Ice Age than previously described"
https://www.blogs.uni-mainz.de/fb09climatology/files/2012/03/Esper_2015_Geochron.pdf
I also wonder if Anthony knows that Jan Esper is a contributor to the PAGES 2K consortium. eg:
Deletehttp://www.nature.com/ngeo/journal/v6/n5/full/ngeo1797.html#contrib-auth
It must be that Watts has never heard of PAGES 2K, the largest effort ever to reconstruct global, hemispheric and continental-scale temperatures for the last 2000 years. I mean, give the man a break: we can hardly expect a simple blogger who is so focused on hockey-stick-shaped reconstructions from the late 1990s to have any kind of awareness of what has happened in the field during the last 10-15 years.
Delete