At WUWT, Tim Ball is pining for the good old days - twenty five years ago. He's written (again) about the medieval warm anomaly and wishing it was global (archived here). I don't know why he harps on about it so. I think it's an excuse to name drop - he says he once met up with Hubert Lamb and he tells everyone so at every opportunity. He likes to pretend they were bosom buddies, though I doubt Hubert Lamb would have remembered Tim Ball, even had he met him.
I've written about the medieval warm anomaly on previous occasions - here and here and in some detail here, for example. There's really not that much more to be said, so I'll just repeat what I've written on another occasion when Tim moaned about the MWP:
Both the medieval warm anomaly and the Little Ice Age were real. What Tim is objecting to is that science now shows that neither of them were global in effect. Not everywhere got warm and cold during those periods and those that did didn't get warm and cold all at the same time.
More studies have been done since 2001, not surprisingly. The latest IPCC report has this to say (TS.2.2.1 Surface):
Continental-scale surface temperature reconstructions show, with high confidence, multidecadal intervals during the Medieval Climate Anomaly (950 to 1250) that were in some regions as warm as in the mid-20th century and in others as warm as in the late 20th century. With high confidence, these intervals were not as synchronous across seasons and regions as the warming since the mid-20th century. Based on the comparison between reconstructions and simulations, there is high confidence that not only external orbital, solar and volcanic forcing, but also internal variability, contributed substantially to the spatial pattern and timing of surface-temperature changes between the Medieval Climate Anomaly and the Little Ice Age.
Tim is rather fond of a graphic from the first IPCC assessment report (FAR), which was published 25 years ago before better reconstructions were available. Deniers only ever show the bottom panel, so for a change I'll show all three panels from Figure 7.1 of FAR:
 |
| Figure 7.1: Schemat1c diagram of global temperature variations since the Pleistocene on three time scales (a) the last million years (b) the last ten thousand years and (c) the last thousand years. The dotted line nominally represents conditions near the beginning of the twentieth century. Source: IPCC FAR (1990) |
Tim says that the IPCC created three "problems":
The three problems it created were
- The Medieval Warm Period (MWP) contradicted their claim that the 20th century was the warmest ever.
- The Little Ice Age (LIA) showed that the present warming trend began prior to the major impact of the Industrial Revolution. Significant production of CO2 by humans began only after World War II.
- The trend of the warming since circa 1650 A.D., the nadir of the LIA, was well within natural variability.
He's wrong. First of all, there is no claim in FAR that the twentieth century was the warmest ever. If Tim had bothered to read the text on the same page as the chart he showed, he would have found this - written 25 years ago in FAR:
There is growing evidence that worldwide temperatures were higher than at present during the mid-Holocene (especially 5000-6000 BP), at least in summer, though carbon dioxide levels appear to have been quite similar to thos of the pre-industrial era at this time (Section 1).
His second point makes little sense. It's not the Little Ice Age that shows that temperatures warmed, it's the temperature record that showed that it has warmed. And it hasn't stopped - and won't for some time yet:

Tim shows no evidence that this recent warming as shown above is "within natural variability" because he can't. It isn't. It can only be explained by greenhouse warming from human activity. Tim just says that because he can get away with writing nonsense on a denier website like Anthony Watts' WUWT.
As if to prove he is no scientist, Tim also writes about something he did manage to read in FAR:
Discussing the various explanations for the LIA cooling they wrote;
“Some have argued that an increase in explosive volcanism was responsible for the coolness (for example Hammer, 1977, Porter, 1986), others claim a connection between glacier advances and reductions in solar activity (Wigley and Kelly, 1989) such as the Maunder and Sporer solar activity minima (Eddy, 1976), but see also Pittock (1983).
Note that these are the same arguments made for the current “hiatus” in temperatures. Also, notice the name of Tom Wigley, former Director of the CRU and a central figure in the 2001 IPCC, attributing the cooling to solar activity. The actual reference given is:
Wigley, T M L , and PM Kelly, 1989 Holocene climatic change, 14C wiggles and variations in solar irradiance Phil. Trans. Royal Society London, (in press).
Apparently, the article listed as “(in press)” never appeared because Wigley’s publication list at the CRU doesn’t list it.
Well, yes. Is Tim now arguing that natural factors don't affect climate? Volcanoes and solar variations do affect the weather - and even climate if the forcings are big enough and last long enough.
You'll also notice that Tim doesn't know how to use Google. Here is the Wigley and Kelly paper that he couldn't find, right where it is meant to be on the site of the Philosophical Transactions of the Royal Society of London - and it's open access as well (maybe only till the end of March).
I won't bother with the rest of the tripe from Tim. It's his usual fare minus any quotes from his heros (Hitler and Osama bin Laden).
To complete this article here is the latest IPCC view of temperatures going back in time. You can see that a lot of work has been done since 1990. Click to enlarge it.
Since Tim Ball is a paranoid conspiracy theorist he attracts them. They all come pouring out of the WUWT woodwork:
Scott
markstoval
Mark and two Cats
RH
The Expulsive
Gunga Din
dbstealey, resident sockpuppetting mod at WUWT, put up one of his wrong charts of Greenland and tells a big fat lie:

Martin picks him up on it and exposes dbstealey's deception:

As well as that, of course, Greenland isn't the world - despite what dbstealey claims.
Wigley, Tom ML, P. M. Kelly, J. A. Eddy, A. Berger, and A. C. Renfrew. "Holocene Climatic Change, 14C Wiggles and Variations in Solar Irradiance [and Discussion]." Philosophical Transactions of the Royal Society of London. Series A, Mathematical and Physical Sciences 330, no. 1615 (1990): 547-560.
You'll also notice that Tim doesn't know how to use Google. Here is the Wigley and Kelly paper that he couldn't find, right where it is meant to be on the site of the Philosophical Transactions of the Royal Society of London - and it's open access as well (maybe only till the end of March).
I won't bother with the rest of the tripe from Tim. It's his usual fare minus any quotes from his heros (Hitler and Osama bin Laden).
Latest temperature reconstructions
To complete this article here is the latest IPCC view of temperatures going back in time. You can see that a lot of work has been done since 1990. Click to enlarge it.
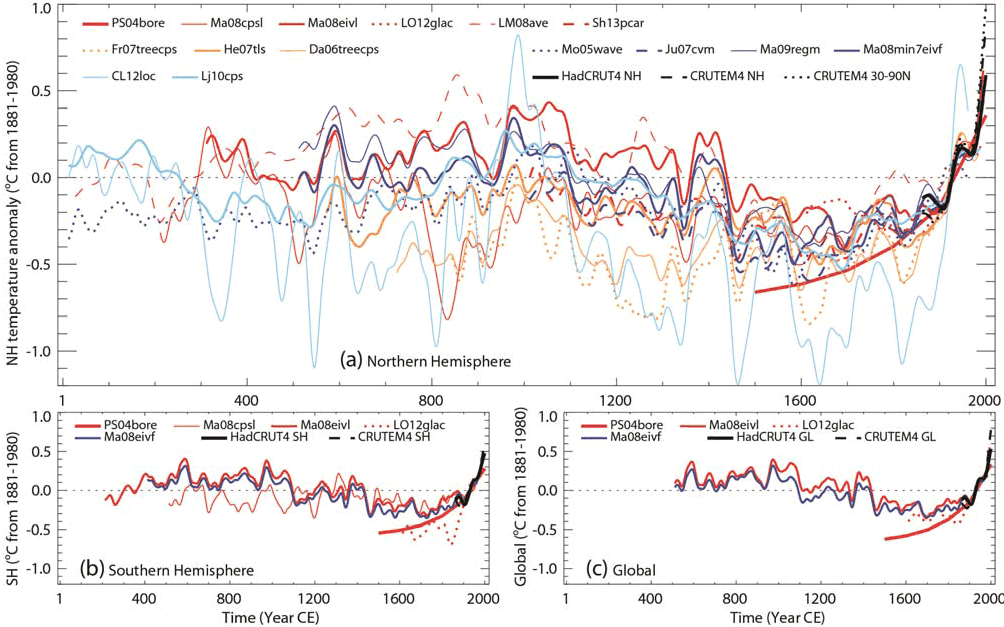 |
| Figure 5.7: Reconstructed (a) Northern Hemisphere and (b) Southern Hemisphere, and (c) global annual temperatures during the last 2000 years. Individual reconstructions (see Appendix 5.A.1 for further information about each one) are shown as indicated in the legends, grouped by colour according to their spatial representation (red: land-only all latitudes; orange: land-only extra-tropical latitudes; light blue: land and sea extra-tropical latitudes; dark blue: land and sea all latitudes) and instrumental temperatures shown in black (HadCRUT4 land and sea, and CRUTEM4 land-only; Morice et al., 2012). All series represent anomalies (°C) from the 1881–1980 mean (horizontal dashed line) and have been smoothed with a filter that reduces variations on timescales less than ~50 years. Source: IPCC AR5 WG1 |
From the WUWT comments
Since Tim Ball is a paranoid conspiracy theorist he attracts them. They all come pouring out of the WUWT woodwork:
Scott
March 22, 2015 at 10:01 amDr. Ball’s article is spot on as usual. The real problem we face is the political agenda supported by the corruption of the scientific method (as elucidated by Dr. Ball).
These are powerful forces. How can they be defeated? I supposed over time, the scientific community will have to just keep presenting the truth over totalitarian elitist objectives.
Like Islamofascim, the Western World will have to wake up and face the facts if it’s to confront the evil and corruption. It’s our only hope. I hope it’s not too late…….
For all you true scientists, thank you for your great works; most especially Dr. Tim Ball.
markstoval
March 22, 2015 at 10:20 am
Another wonderful essay Dr. Ball. Best read of the week for me.
Considering all that you wrote (and many other items to boot), I wonder why this site will send a post to moderation for using the word “fraud*lent”. That word is so utterly descriptive of the “team’s” actions.
Mark and two Cats
March 22, 2015 at 10:53 am
Warmunist, malthusian, totalitarian government enthusiast, and current “science tsar” John Holdren is a perfect match for the obama junta.
RH
March 22, 2015 at 11:07 am
It’s possible we could enter a new LIA, and not notice it because our technology allows us to easily cope. Can you imagine the last two winters in the central/eastern U.S. without modern technology? We’d have seen failed crops, starvation, pestilence, and thousands of people freezing to death. Instead, we bitch and moan, but mostly shrug it off. Maybe we’ve already entered a new LIA.
The Expulsive
March 22, 2015 at 11:17 am
Any “political corruption” cited is solely about taking advantage of a “crisis” in order to make some form of change. In the case of “tax and spend” politicioans it has been the rollback of taxation that followed Thatcher and Reagan that needs to be overcome in order to pursue the direction they want. What better crisis than climate change that will reduce us all if not stopped, and how better to counter it than by a “carbon tax” enterered into for the “good” of the planet? Long live political expediency.
Gunga Din
March 22, 2015 at 12:23 pm
If the past was natural and no caused by Man then there is no reason to try and control Man now.
Man’s CO2 emissions is a puppet string.
dbstealey, resident sockpuppetting mod at WUWT, put up one of his wrong charts of Greenland and tells a big fat lie:
March 22, 2015 at 10:38 amThe MWP and prior warming episodes were all warmer than now. The Holocene is gradually cooling, as we see here from Alley’s data:
Martin picks him up on it and exposes dbstealey's deception:
March 22, 2015 at 12:08 pm
It is warmer now in Greenland than during the MWP. That Alley graph posted by dbstealey is misleading as it claims that the present is the year 2000 when in fact it is the1850’s! Well before the modern warming!
As well as that, of course, Greenland isn't the world - despite what dbstealey claims.
Wigley, Tom ML, P. M. Kelly, J. A. Eddy, A. Berger, and A. C. Renfrew. "Holocene Climatic Change, 14C Wiggles and Variations in Solar Irradiance [and Discussion]." Philosophical Transactions of the Royal Society of London. Series A, Mathematical and Physical Sciences 330, no. 1615 (1990): 547-560.
With apologies to those who have seem me write this before, but for the thread:
ReplyDeleteIf there was a global and synchronous 'MWP' as warm as or warmer than the late C20th, it would be strong evidence that the climate system is at least moderately sensitive to radiative perturbation.
If so, the climate system will be sensitive to the radiative perturbation from sharply increasing GHG forcing in the modern period.
Contrarians arguing for a 'hot MWP' are arguing for a sensitive climate system and so for very real concern about the climate response to anthropogenic emissions.
A hot MWP could imply three things:
Delete(1) Stronger feedbacks, which means a higher climate sensitivity.
(2) Stronger external forcings, which could be working either way today (increase or reduce the warming).
(3) Stronger internal variability, e.g. atmosphere-ocean exchange, which also could be working either way today (increase or reduce the warming).
Of course, it could also have been a combination of 1, 2 and/or 3.
As a whole, the risks would be larger than with a less warm MWP.
Lars Karlsson
DeleteSince there's no evidence for a strong forcing increase (2) during the period ~900 - 1200CE and (3) requires that the climate system be sensitive to radiative perturbation anyway, all arrows point to (1). Unless one goes with the actual evidence :-)
In that case, there appears not to have been a global, synchronous, hot MWP after all. Mystifyingly, our contrarian chums strenuously argue the contrary.
Confused they is.
"dbstealey, resident sockpuppetting mod at WUWT, put up one of his wrong charts of Greenland and tells a big fat lie"
ReplyDeleteWell, lets remember dbstealey's comment from: http://blog.hotwhopper.com/2015/03/another-conspiracy-theory-at-wuwt.html
"Since his lips were moving when he made his denials, I think we can discount whatever the Administration’s spokesman says. Only the truly credulous and naive would take them at their word.
When someone is such a serial liar as Obama, the prudent thing to do is to assume that he hasn’t suddenly found Jesus. ."
The credulous and naive people are to be found at WUWT. I will leave people to identify for themselves who the serial liar is.
See also
ReplyDeletehttp://www.desmogblog.com/2015/01/26/medievaldeception-2015-inhofe-drags-senate-dark-ages
For history of fig 7.1(c), a 1965 sketch that covered ~21x34mile patch of central England.
So they argue the MWP was warmer because of evidence from temperature reconstructions. They then argue the current warming was not warmer because they do not trust the temperature reconstructions.
ReplyDeleteAn interesting observation of Conspiracy Theorists is they can accept contradictory theories simultaneously, as long as the contradictory theories all support their core conspiracy theory.
Harry TO
DeleteAn interesting observation of Conspiracy Theorists is they can accept contradictory theories simultaneously
More in the same vein as hot MWP = sensitive climate :-)
Consistency is the hobgoblin of small minds, etc.
I wish Tim Ball (or someone) would point to the data behind Lamb's graphs. They look hand drawn to me, based on notions about past climate rather than hard data.
ReplyDeleteA lot has been said about the Lamb schematic in the IPCC report (potholer54 has an excellent video on youtube). It has been used by many including Lord Monckton for anti-global warming propaganda, to claim the MWP and LIA were deliberately covered up.
DeleteThe irony is the one that appears in the IPCC report is a poor chart, it is a schematic and poorly-labelled. I am sure that if it was used instead to support some part of AGW, we would never hear the end of how bad it is from the deniers.
I have. Not that it'll do any good, and will probably attract vitriol. I've also had a go at stealey with his GISP2 ice core data that ends in 1855 before modern warming and the denialosphere's "cooling" Holocene.
DeleteThe fact that GISP2 ends in 1855 and only shows a reconstruction of Central Greenland temps has been pointed out on WUWT many times. But they continue to use it, plus the "adjusted" version where someone has tacked some global temps onto the end of it.
DeleteIf you are referring to account dbstealey, well he will never admit to his points being wrong, he will just change the subject when cornered, toss out some insults, go off on a rant etc. But it appears to be his job on that site to do just that.
Yes I came across dbstealey a few years ago when I ran rings around him re Meteorology (I'm retired from the UKMO). He did that then, and it's the typical response from the like. I shouldn't for all the good it does but cant resist to prick their bubble.
DeleteRead MedievalDeception 2015: Inhofe Drags Senate Back To Dark Ages.
DeleteI explain where the curve came from, with links to the relevant sources.
900AD-1680AD was estimated from rainfall and plant records, i.e., everything before the Manley C.E.T. record.
All this is well-known.
Yes, of course it is John - the Denialosphere lives, well, elsewhere and once the myth takes root, no amount of logic, evidence or facts will dislodge it.
DeleteJones et al 2009 Appendix A presents some detective work concerning the FAR figure.
ReplyDelete"In summary, we show that the curve used by IPCC (1990) was
locally representative (nominally of Central England) and not
global, and was referred to at the time with the word ‘schematic’."
I am beginning to wonder if ANY of the so-called 7.1 charts (a, b, c) from the IPCC report are truly global.
DeleteThe whole situation is rather amusing, the people putting together the IPCC report back in 1990 would not have been able to foretell that in 2015 people would be splitting hairs over the quantitative values - if so then they might have provided a table of their data.
DeleteI am happy to go with the interpretation that the charts were more for illustration of the text than anything else and they are indeed schematics only.
IPCC(1990) was done in a hurry, and anyone who hasn't read the relevant pages might look at this 4-page annotated version.
DeleteThey knew they didn't know much, and said so. Real reconstructions got going.