The average for the five months to the end of May is 1.15 °C, which is 0.29 °C higher than any previous January to May period. The previous highest was last year, which with the latest data had an anomaly of 0.86 °C.
There are now eight in a row of "hottest months" from October 2015 to May 2016 (that is, hottest October, hottest November etc). If we could look back over the entire Holocene, it's probably more than 7,000 years since there was a similar run of hottest months on record, that is, not since the Holocene climatic optimum (it's probably hotter now than it was back then).
All of the previous months (October to April inclusive) had an anomaly more than one degree Celsius above the 1951-1980 mean. All of the previous months had an anomaly higher than any month outside of that October to April period. May this year had an anomaly of 0.93 °C, which is lower than the anomaly in January 2007 (0.96 °C.)
Below is a chart of the month of May only. Hover over the chart to see the anomaly in any May:
Figure 1 | Global mean surface temperature anomaly for the month of May only. The base period is 1951-1980. Data source: GISS NASA
Figure 2 | Global mean surface temperature anomaly for the 12 months to May each year. The base period is 1951-1980. Data source: GISS NASA
El Niño no more
You can see the global mean temperature trend by month in the chart below, for recent El Niño years:
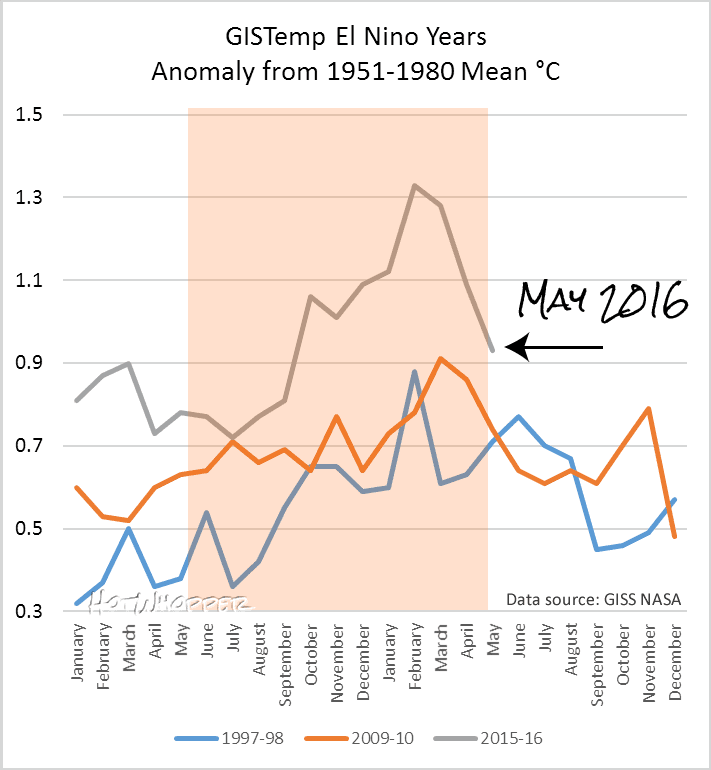 |
| Figure 2 | Global mean surface temperature for El Nino years. Data source: GISS NASA |
There's
 |
| Figure 3 | Global mean surface temperature for strong or moderate/strong El Nino years that were followed by a La Nina. Data source: GISS NASA |
Where was it hot?
Once again the high latitudes in the northern hemisphere had high anomalies this month but not as high as last month. There's also some parts of Antarctica that were very, very hot (well, it's still rather cold down there, but much hotter than the 1951-1980 average).
 |
| Figure 4 | Map showing mean surface temperature, anomalies for May, from the 1951-1980 mean. Source: GISS NASA |
Below is April for comparison:
 |
| Figure 5 | Map showing mean surface temperature, anomalies for April, from the 1951-1980 mean. Source: GISS NASA |
Year to date average surface temperature
The chart below tracks the year to date. Each point on the plot is the average of the year to that month. For 2016, the last point is the average of all months to date including May. This year is tracking well above 2015, largely because of the El Niño. To drop below the average for 2015, the average anomaly for the next
 |
| Figure 5 | Global mean surface temperature, progressive year to date to May 2016. Data source. GISS NASA |
Related HotWhopper articles
- El Niño to La Niña years - May 2016 with more detail here
- Seven in a row: April is the hottest April on record, a 7000 year record? - May 2016
- Hottest March on record, tracking El Niño, and a year to date comparison - April 2016
- Hottest February by far at a whopping 1.35 C above the 1951-1980 mean - March 2016
- Hottest January on record, with El Niño years comparison - February 2016
The Arctic sea ice extent, Antarctic sea ice extent and Greenland melt are all pointing in the same direction.
ReplyDeleteAll eyes on the Northern Hemisphere summer...
... or the anomaly would need to be lower than 0.653 according to Tamino's latest! Notwithstanding such fractional differences I reckon there's pretty-well Buckley's this year isn't going to set another record, La Nina or no. That bottom chart blows the mind each time one sees it!
ReplyDeleteAlso, there are only seven months left this year, not eight. Great article though! I'm amazed how fast Sou can pull all this information together.
DeleteThanks, Greg - and good catch :) (Fixed)
DeleteAnd Lord Haw-Haw says?
ReplyDeleteSou writes "Last month is the first time in seven months that the GISTemp monthly anomaly is one degree Celsius below the average from 1951-1980. "
ReplyDeleteShouldn't that be above the average from 1951-1980. You must be channelling McLean. ;-)
Thanks Dave, fixed now :)
DeleteI think Sou meant it is the first month out of the last seven to be less than a full degree above the 1951-1980 average.
DeleteSou,
ReplyDeleteYou say: If we could look back over the entire Holocene, it's probably more than 7,000 years since there was a similar run of hottest months on record,
What is your source for that? That sounds like a bold claim, but maybe I'm misunderstanding what is meant?
I'll expand on it this way. Say you had the monthly temperatures for every month of the past 10,000 years. Until recently (probably) the hottest time of all was around 7,000 to 8,000 years ago. If you looked back, for any month up to around 1970 (or even later) it was probably hotter 8,000 years ago. That would mean that the last time there would have been a string of "hottest months" on record, was probably around 8,000 years ago. Until now. Now it's probably hotter than then.
DeleteEven if not, it's probably the hottest it's been for at least 7,000 years.
Therefore in the entire record, there's probably not been a string of 8 hottest months (out of the Holocene) for at least 7,000 years, until now.
Got it. Thanks!
DeleteI agree. 2015/16 must be higher GMST than so-yesterday so-called Holocene Optimum 8,000 years ago. Our next exciting goal is Eemian Optimum 133,000 years ago. Go team !
DeletePlease explain: How isn't the first and the last diagram contradicting one another?
ReplyDeleteThe first chart is just the month of May each year.
DeleteThe last chart is the average for the year to the end of each month on the horizontal (x) axis. For each year, the first point is just January, the second point is the average of January and February, the third point is the average of January to March, the fourth point is the average of January to April ... and so on to the last point.
The last point for every year except this one is the average for the year to December. This year only goes to May, so it's the average for the year to May - ie the average of Jan, Feb, March, April and May for 2016.
Sou,
ReplyDeleteI told you last month that there was a run of 9 (yes, nine) hottest months in a row from January 1944 to September 1944. This happened about 73 years ago, nothing like the 7,000 years that you are claiming.
The December before this run of 9 months was not a record month. But the October and November just before that were also record months. So the were 11 record months in a 12 month period.
That was diligent sleuthing on your part, Sheldon. Thing is, as I wrote above and said to you at the time, the temperatures pre-1950 were most certainly eclipsed by higher temperatures between 7000 years ago and now. Therefore they would not have constituted a run of "hottest" looking back over that period. By contrast, it would be much less likely that in the past 7,000 years there has been a run of months with hotter temperatures than those we've just seen.
DeleteTwo more points are worth making as well.
DeleteThe sea surface temperatures in WWII are not all that reliable, in that it is difficult to calibrate them with sea surface temperature before and after. (The wartime vessels were fewer and constructed differently.) There is an unusual hike around that time for which there isn't an explanation AFAIK, other than that.
The other point is that the earlier you are in the instrumental record, the more likely it is that you'll have records broken - both high and low.
Those two points aren't relevant to the 7000 year record I'm talking about. I just thought they were worth adding:)
Figures 1 & 2 seem to illustrate Sheldons point quite, well at least graphically speaking
DeleteBut, to me they do an even better job of showing how ridulous it is too
It doesn't look like Sheldon Walker read Sou's answer from May 2016.
DeleteIn terms of consecutive record-breaking months in this GISTemp dataset (LOTI), 1997-98 had 6 in a row (Sep-Feb), then a month off (March 1990 was warmer), then another 5 months in a row (Apr-Aug).
ReplyDeleteFor 2015-16 to hit 9 in a row, June's anomaly would need to exceed 0.78, and then for 10 in a row August must be >0.74...moderate likelihood for those maybe? 11 or 12 months in a row seem much less likely though: September would need to be >0.81 (Sep 2014) and October >0.90 (Oct 2014).