 Remember Don Easterbrook? He's the retired geology professor who knows less than nothing about climate science. He is the one who falsely claims the temperature on the summit of Greenland is a proxy for the temperature of the entire world.
Today at WUWT he posed a question in response to an article about recent global temperatures. Don Easterbrook wrote:
August 20, 2017 at 5:15 pm
And where do 1936 and 1934 fit in these ‘record temps?’ Before blatant tampering by NOAA and NASA, they were easily the hottest years (and probably still are!)
One can come up with some hypotheses about Denier Don from that question, not all of which are mutually exclusive:
- He is suffering some mental aberration.
- He is in denial about global warming.
- He knows that the world is warming and is deliberately spreading false information.
- He thinks the USA is the entire planet (some deniers still think that 1934 and/or 1936 were the hottest years ever recorded in the USA).
- He's forgotten that he has previously claimed that temperatures on one of the highest points on the ice sheet on Greenland was the same as the temperature of the entire world.
- He's a "climate hoax" conspiracy theorist, with his false allegations of fraud.
Where do 1936 and 1934 fit in these ‘record temps?
Still, despite poor Don probably never coming to grips with the subject of climate, I'll have a shot at answering his question, with the help of the experts at NASA. In the 1930s, the annual average global surface temperature was more than one degree Celsius colder than it was last year. The warmer of his two years, 1934, was 1.14 C colder than the average for 2016.
 |
| Figure 1 | Global mean surface temperature. Data source: GISS NASA |
Where and when was it hot?
In 1934, the warmer of Don's two years, it was cool compared to recent years, as you'd expect. Move the arrow at the left to the right to compare 1934 with 2016.
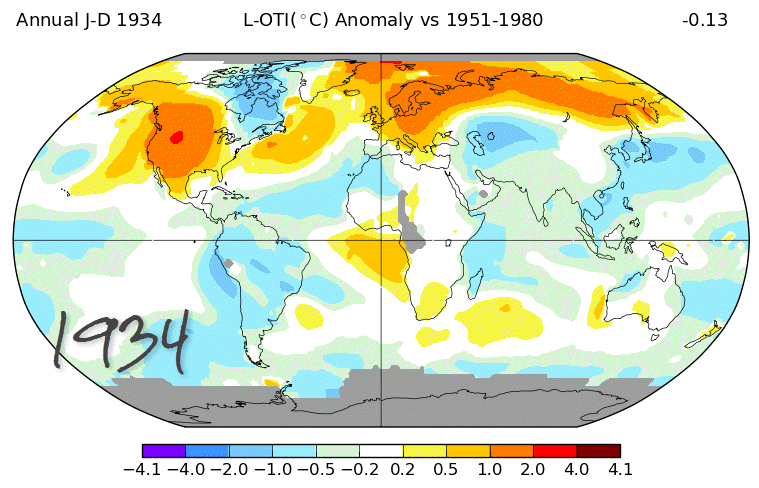

Figure 2 | Maps showing mean surface temperature, anomalies for 1934 and 2016, from the 1951-1980 mean. Data source: GISS NASA
If you hover over the chart below you will see the year of each anomaly.
Figure 3 | Global mean surface temperature. Data source: GISS NASA
Don gets no sensible reaction at WUWT
No-one bothered to correct Don's silly question. I suppose he's too revered by Anthony Watts and his followers, so no-one is game. A couple of people did reply, with equally silly thoughts.
Werner Brozek said something about satellite temperatures:
August 20, 2017 at 7:47 pm
“And where do 1936 and 1934 fit in these ‘record temps?It would be nice if we had global satellite data back then.
I can't figure out what Matt G was thinking. It makes no sense to me at all when he wrote:
August 20, 2017 at 5:30 pm
Hope you have a full recovery.
The modern temperatures appear warmer than the 1930’s and 1940’s because the 0.5c cooling in between has been reduced to almost a zero trend over the decades.
That means 0.5c warming after should bring it back to how it was, but because this trend has almost been removed, it makes it almost 0.5c warmer instead.
Greenland vs the globe
Seeing Don's comment reminded me of his Greenland fetish, which in turn reminded me of a video that some nincompoop put out some time ago. I took the liberty of adapting it at the time:
Somehow, imaginary historic warm periods are just no fun without the odd viking being involved.
ReplyDeleteI would never let a climate change denier invest my money, as they clearly do not know the difference between a spike and a trend.
ReplyDelete1936 way well have been the warmest year on record in the US, but it is irrelevant to global warming.
Nope, 1936 isn't the warmest. BEST has it as #4 (or 5?)
Deletehttp://berkeleyearth.lbl.gov/regions/contiguous-united-states
Here's some who model climate and stock prices with the mathbojumbo:
Deletehttp://jennifermarohasy.com/2017/08/recent-warming-natural/
Someone should tell Denier Don that he should add HADCUT, JMA, and BEST to his list of "tampering". Gets seriously funny for those slightly less conspirationally inclined to realise Denier Don must believe in one humongous conspiracy that spreads all over the world. They'll run into a serious case of cognitive bias. Some will recover from that, fortunately, and realise WUWT may not be the place to be if someone as nuts as Denier Don is elevated to someone very knowledgeable by the crowd around him.
ReplyDeleteI'm trying to figure this one out: how can Desperate Don tell which year is the record if all the temperature data has been tampered with?
ReplyDeletePerhaps the Wutters should be reminded of Don's forecast, made on their site back in the relatively cool year of 2008, when he predicted "the beginning of global cooling by 2007 (± 3-5 yrs) and cooling of about 0.3-0.5° C until ~2035".
ReplyDelete10 years and a further ~0.4C warming later Don's failed prediction has been judiciously swept under the carpet.
"One can come up with some hypotheses about Denier Don from that question"
ReplyDelete7. Just like the other con Don in the White House, he simply does not care whether what he says is true.
Connoisseurs of inadvertent irony may enjoy the last paragraph of Easterbrook's 2011 book Evidence-Based Climate Science:
ReplyDelete"The reader is invited to toss aside all of the political rhetoric that has been introduced into the global warming debate, focus on the scientific evidence presented in the papers in this volume, and make your own conclusions. Dogma is an impediment to the free exercise of thought—it paralyses the intelligent. Conclusions based on preconceived ideas are valueless—it is only the open mind that really thinks."
Easterbrook makes errors in that book that would embarrass a dim first-year undergraduate. One, selected at random:
"The average daily temperature is -55.1 °C (-67.2 °F) at Vostock and -49.4 °C (-57 °F) at the south pole. In order to get any significant amount of Antarctic ice to melt, temperatures would have to rise above the melting point, i.e., more than 100 °F. Thus, claims of large scale melting of the Antarctic ice sheet are highly exaggerated."
Clarification: the first quote is the last paragraph of the preface.
DeleteDelingpole has been giving Easterbrook & Mahosy a run for their money :
ReplyDeletehttps://vvattsupwiththat.blogspot.com/2017/08/delingpole-doubles-down.html
What's Delingpole's/(Goddard's) "trick" this time? I have no great wish to waste precious lifetime to delve into what I assume is dishonesty if someone else already has.
DeleteEven more amusing is his belief that global climate follows conditions on Mt. Baker (his "Glacial Decadal Oscillations" in this post: http://www.globalresearch.ca/global-cooling-is-here/10783 ). Severe glacial myopia.
ReplyDelete