 According to GISS NASA, the average global surface temperature anomaly for February was 1.10 °C, which is 0.22 °C lower than the hottest February in 2016 and the second hottest February in the record.
Here is a chart of the average of 12 months to February each year. The 12 months to February 2017 averaged 0.94 °C above the 1951-1980 mean and was almost identical to the 12 months to February 2016, being just 0.01 °C hotter. This makes it the hottest March to February 12 month period on record.
Figure 1 | Global mean surface temperature anomaly for the 12 months to February each year. The base period is 1951-1980. Data source: GISS NASA
Figure 2 | Global mean surface temperature anomaly for the the month of February only. The base period is 1951-1980. Data source: GISS NASA
ENSO year comparisons - another El Niño?
Although there was no La Niña after the recent El Niño, I've kept the chart below going. You can see the global mean temperature trend by month in the chart below, for the strongest El Niño years since 1950, which were followed by a La Nina. I've included the 2015/16 period for comparison. NOAA did indicate there was a very weak La Nina. The BoM ENSO update didn't, and is now showing neutral (but with a small chance of a weak El Nino later this year).
Not counting 2015/16, of the seven very strong, strong and strong to moderate El Ninos since 1950, there were only three that were followed by a La Nina. The chart spans a three year period. That is, for the 2015-16 El Niño and subsequent, it goes from January 2015 to December 2017, or would if the data allowed. (For a more detailed explanation see the HW articles: El Niño to La Niña years with more detail here.)
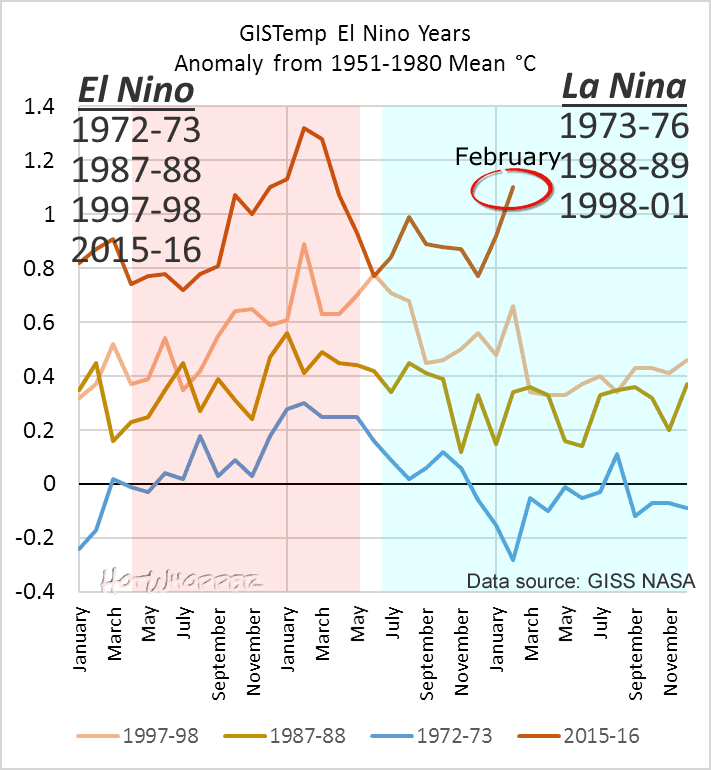 |
| Figure 3 | Global mean surface temperature for strong or moderate/strong El Nino years that were followed by a La Nina. Also includes the 2015/16 El Nino for comparison. Data source: GISS NASA |
Where was it hot?
Last month it was very hot in the northern latitudes, not just the Arctic. Europe, but particularly North America and Russia were also extremely hot. Few places in the world could be described as cool in February.
 |
| Figure 4 | Map showing mean surface temperature, anomalies for February, from the 1951-1980 mean. Source: GISS NASA |
Figure 5 | Global mean surface temperature anomaly by latitude for February 2017. The base period is 1951-1980. Data source: GISS NASA
Schadenfreude to be sure, and it's bad for humanity. But if this is indeed the 'new normal', then I'm absolutely tickled pink that it's happening on The Donald's watch :-)
ReplyDeleteETA: today is 'Day of the Donald' no. 128, counting from that infamous day after the election, 09 Nov 2016.
Delete128 Days Later.
DeleteThat seals it. I'm moving to Iqaluit -- the only blue spot in the arctic.
ReplyDeleteNow let's not be too hasty--but do you know if Inuvit has a tourist office or chamber of commerce? Iqaluit seems a bit far north though I suppose I could be persuaded. Maybe I could take up sailing.
DeleteIt certainly was a bit warm the last month or so. I'm in Kingston and I was parading around in a tweed jacket. A tweed jacket in February and early March?
I actually am moving, though admittedly not for the climate.
DeleteIqaluit does have a tourist office in the library (also a museum, which I find better than the museum next door, but maybe that's because the museum next door was under renovation when we visited). And there's a chamber of commerce. I have doubts there are any global warming deniers in it, it's a bit hard to maintain that fiction in the arctic.
Best wishes on the move. I've never even been north of 60 so it seems a long way up.
DeleteOh, but its only the second hottest: that's a sure sign of an ice age. I'm not sure quite why, but I guess Wayne Tracker could explain.
ReplyDeleteFor those not in the know, Wayne Tracker was Rex Tillerson's sneaky email when he was at Exxon.
DeleteThe first ONI number for the year is -0.4. The anomaly should be in the range of .5-.6 ℃.
ReplyDeletePDO stays positive... 38 straight months in a row. How often does that happen?
Berkley earth year to date compared to average all years
ReplyDeleteAlong with likely years average for 2017.
https://pbs.twimg.com/media/C6qL7knVwAAgFpz.jpg
Must be an ice age coming some time soon.
Yet another cross reference to Earth Obnservatory, which has a lovely video of underwater El Nino action. Don't know how long the Trumpsters will leave the site alone, but it's there now.
ReplyDeleteUnder the Surface of El Niño