His article refers to this paper (subs req'd) by Kunkel et al (2013) which discusses the Probable Maximum Precipitation as climates change and, in particular, under the RCP8.5 scenario.
When it rains it pours...
Probable Maximum Precipitation (PMP) is a measure of heaviest downpours possible at a particular location. It is defined as:"...the greatest depth of precipitation for a given duration meteorologically possible for a given size storm area at a particular location at a particular time of the year, with no allowance made for long-term climatic trends." (Source: WMO, 1986 via Bureau of Meteorology)According to the abstract, Kunkel et al postulates (my bold)
"Climate model simulations indicate a substantial future increase in mean and maximum water vapor concentrations. For the RCP8.5 scenario, the changes in maximum values for the continental United States are approximately 20–30% by 2071–2100....Thus, our conclusion is that the most scientifically sound projection is that PMP values will increase in the future due to higher levels of atmospheric moisture content and consequent higher levels of moisture transport into storms."
Let's look at the RCP8.5 scenario of IPCC AR5:
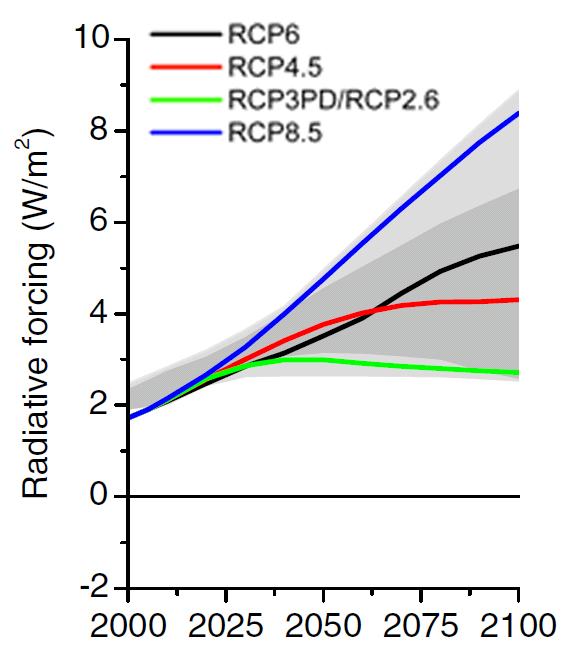
It's the one where we let things get way out of hand and results in a radiative forcing of 8.5 W/m2 by 2100.
How Willis ignores the hydrological cycle
Willis calculates the energy required to increase water vapour by 20% and says it can't be done. Now I'm not about to try the calculation myself - I'll leave that to you if you're interested. The thing I did notice was that Willis left out half the equation. He calculated the energy needed to evaporate water but didn't calculate the energy released when that water condenses into clouds and then falls as rain and snow. Nor did he even mention it. (Update: In the comments, Nick Stokes among others points out that the energy needed to evaporate more water is needed only once, not repetitively, but Willis is not having a bar of it.)Willis puts up a chart that he says shows global precipitation. He says the chart shows no trend, despite the fact that just eyeballing the chart it appears as if mean precipitation has been rising at least since the 1980s. I haven't done a trend analysis, but other people have.
The hydrological cycle is pretty well self-sustaining (for a given solar input). If water didn't fall down as rain and snow after it evaporated, we'd have all drowned in a moisture-laden atmosphere long before we'd even evolved - using Willis' type of logic:)
As the world heats up, more water evaporates. This additional water vapour has the effect not just of making the world heat up more (water vapour is a greenhouse gas) but of making more precipitation. The water cycle rotates in hours to days. (According to SkepticalScience, it's estimated that for every degree Celsius rise in average global temperature there is a 6-7.5% increase in water vapour.)
Are you building a dam?
If you are planning on building a dam or any building that you want to survive several decades, it would pay to take note of expected Probable Maximum Precipitation (PMP) as your local climate changes in this warming world. If you're in Australia, this 2009 paper from the Bureau of Meteorology is a useful start. As it states in the Executive Summary (my bold):For certain applications (including the design of dams) engineers need an estimate of what is referred to as the ‘PMP Design Flood’. PMP is one of the required inputs when estimating the PMP Design Flood. However, PMP estimation currently does not take into account that estimates might change under a changing climate. Since structures designed using such estimates have long life spans it is vital to consider potential effects of climate change on estimates of Probable Maximum Precipitation.
Caution
Do your homework. Would you trust a scientific specialist or a science-denying blogger? I reckon you ought to avoid Willis E Constructions if you want your dam or building to endure more than a decade or so :(Tool Poll
After using a computer to generate his charts, Willis makes the comment:The part I really don’t like in all of this is that once again, all of their claims are built on computer models.I've added a poll to the sidebar so you can pick which tool or tools you think deniers use to make climate projections.
