Despite a flurry of articles during the cold snaps in the USA last month, there has been a noticeable drop in the number of "ice age cometh" articles at WUWT in the past few months. I've not noticed anything recently from
David "funny sunny" Archibald or
Ed Hoskins or
Tony Brown or
Norman Page. There is still the occasional remark in the comments that "it's about to cool".
Using trader tools to predict global surface temperature
A few days ago Eric Worrall wrote an "it's about to cool" article (
archived here). (Some people might remember Eric. He was eventually banned for his repetitive conspiracy ideation about eugenics and stuff at
Watching the Deniers )
Eric figured it might be about to cool based on an indicator used by share traders,
moving averages. His notion wasn't embraced by the chorus, who weren't singing in tune. Several people pointed out that share trading indicators work mainly because so many people use them. They are an indication of human behaviour. Of course, with temperatures going up the way they are, sensible human behaviour would be to cut back a lot on greenhouse gas emissions. That will slow the rising trend but it won't reverse it until we cut emissions very drastically. Even then it will take a very long time to reach equilibrium in the slow moving carbon cycle (like thousands and thousands of years).
January as a leading indicator for the year
Today there was an article by Walter Dnes about how the global average surface temperature in January is a leading indicator of the annual global average surface temperature (
archived here). Walter worked out that if a January was hotter than the previous January, the chances were very high that the full year would be hotter than the previous year, and vice versa.
Walter found that between 1980 and 2013, there were 20 years for which January was warmer than January of the previous year, of which 17 whole years were warmer than the previous year. Two of those years that weren't warmer were affected by Pinatubo (1991 and 1992). 2003 had a warmer January but the year as a whole wasn't warmer.
As for cooler January's, there were 14 that were cooler than the previous January. Of these years, 10 were cooler than the previous year. 1993, 1994, 2000 and 2012 were exceptions.
What almost no-one commented on (Willis Eschenbach was one exception) was that the odds of any particular year being warmer than the prior year are better than even. Of the 33 years, 20 were warmer than the previous year, only 13 years were cooler than the previous year.
Maybe more of the WUWT deniers are now accepting that the world is heating up.
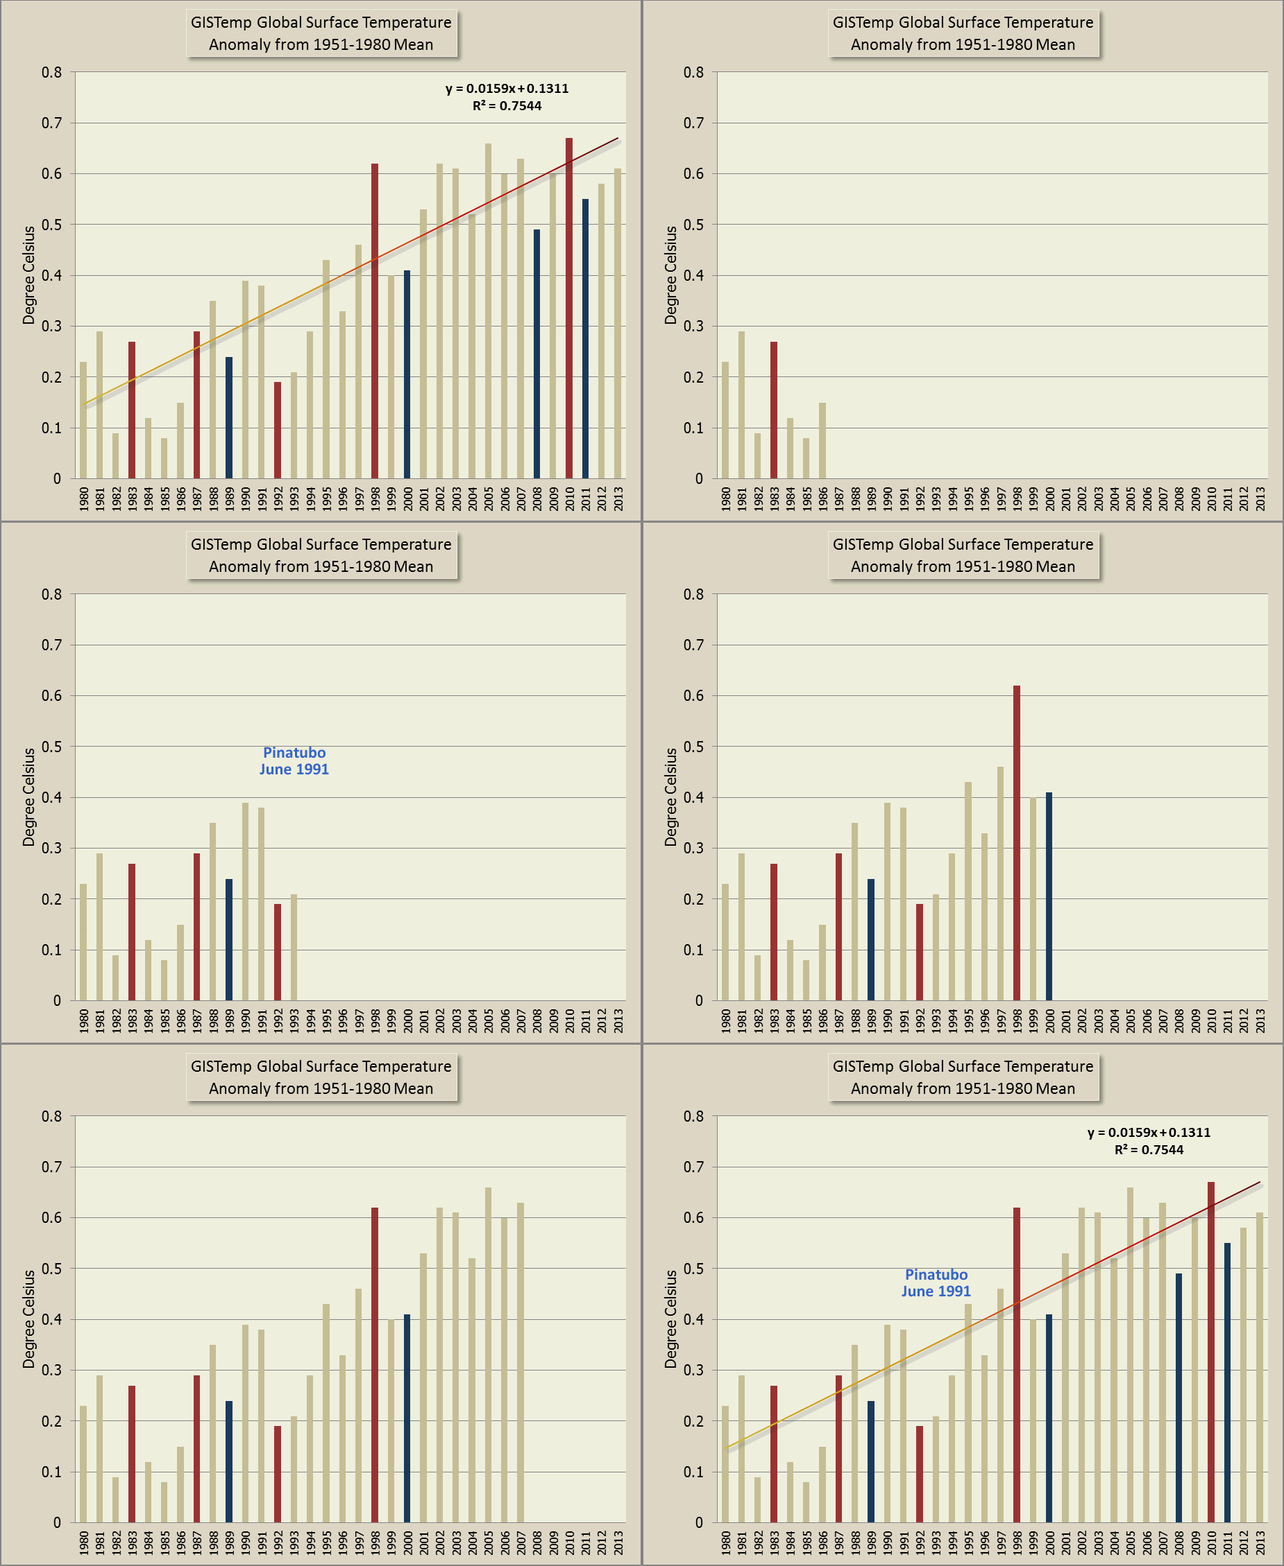
Here's a chart of the period. I've marked the ENSO years using
this WMO press release as a guide, which may be a tad conservative compared to some other records. I've also indicated Pinatubo. I've even done what Bernard J. suggested some time back, and animated the chart. (Is this the sort of thing you had in mind, Bernard?) Click to enlarge as always.
Each La Nina year is warmer than the previous La Nina year. All but one El Nino year is warmer than the previous El Nino year, and that one was 1992 (post Pinatubo). The linear trend for the period from 1980 to 2013 inclusive is 0.16°C a decade. There was not a single year colder than the 1951 to 1980 mean.
From the WUWT comments
Here is a sample of comments to Walter Dnes article (
archived here).
There are a couple of the usual conspiracy theorists like
Latitude who says (excerpt):
February 1, 2014 at 4:49 pm
Note: GISS numbers are…….fake
Jeff Alberts doesn't "believe in" temperatures or anomalies and says:
February 1, 2014 at 6:54 pm
Once you realize there is no global temperature, and therefore no anomaly, this article becomes pretty much moot.
Eric Worrall makes an irrelevant and meaningless comment and says:
February 1, 2014 at 4:50 pm
So, BAU is still the best short term climate model, despite billions of taxpayer’s money spent on developing analytical approaches.
I want a refund :-)
MikeN says:
February 1, 2014 at 5:24 pm
That could just be luck.
Werner Brozek says, sagely:
February 1, 2014 at 5:32 pm
We have all heard of numerous adjustments, but I think that this is one time that the adjustments are not relevant. After all, we are not interested in the rate of warming over the last several decades but how the January anomalies predict annual anomalies. And any adjustments that are made would affect January as much as the annual anomaly more or less equally.
Kip Hansen says somewhat obliquely:
February 1, 2014 at 5:32 pm
If this were a medical issue, I would ask to see some prior explanations regarding biological plausibility.
Robert of Ottawa says:
February 1, 2014 at 5:47 pm
Coin toss.
walterdnes replies to the "just luck" and "coin toss" responses with (excerpt):
February 1, 2014 at 5:50 pm
If you get 70% to 90% accuracy at blackjack in Vegas, you get thrown out of the casino for being a card-counter
walterdnes qualifies the above with:
February 1, 2014 at 6:08 pm
wws says: February 1, 2014 at 5:58 pm
> And to put it even more simply yet: You are predicting that the numbers you have already measured are likely to influence your final measurement. There’s a reason oddsmakers generally don’t take any more bets once the game has started.
I agree with what you’ve said. That’s how leading indicators work. There is still some value in getting a future forecast.
Tom says:
February 1, 2014 at 7:53 pm
I don’t understand. I thought this was ment to be humerous yet from the comments it appears all are taking it seriously
Willis Eschenbach says (excerpt):
February 1, 2014 at 8:21 pm
...I agree. I don’t find this result to be anything other than expected. Since your “leading indicator” is included in the data you are trying to predict, of course it will be correlated....
...Finally, the author hasn’t adjusted for the fact that the data has a trend … and that means that on average, both the January to January and the year to year data both will have a positive value.
I may run a monte carlo analysis on the data to confirm what it looks like, but as far as I’m concerned, and with my apologies to the author, this is a non-event. This is what you’d expect.
Willis later put up a bunch of charts from his Monte Carlo analysis and wrote (excerpt):
So … what did I find from that? Well, the so-called “leading indicator”, which isn’t leading, agrees with the annual results some 66 percent of the time, with a standard deviation of ± 4%. This means that 95% of the “leading indicator” results for the proxy temperature datasets fell between 58% and 74%. And this, as I suspected, means that at 70%, the author’s “leading indicator” is not doing any better than random chance … as as such, it is useless as a prognostication device.
(Given Willis' "emergent phenomena" (Gaia style) hypothesis, it seems odd that he's now acknowledging that Earth is getting hotter. Science deniers can be very inconsistent.)
To which
walterdnes responded (excerpt):
February 1, 2014 at 9:44 pm
For the satellite era, the GISS numbers I get are 85% (17 of 20 when forecast warmer than previous year) and 79% (11 of 14 when forecast cooler than previous year). That’s with the Pinatubo years included. The numbers look even better with Pinatubo years eliminated.
Nick Stokes says:
February 1, 2014 at 9:43 pm
I’ve put here a table of the correlation coefficients for the six land/ocean indices I deal with. Each is over the whole length of data. The correlations are between each month and the annual (calendar) average. Naturally they improve as you advance in the year; mid-year months are a more representative sample.
I don’t think the result is worthless. As said, Jan is a leading indicator. It has limited use as a predictor.