.
Showing posts with label Ira Glickstein. Show all posts

Tuesday, December 13, 2016

Cycling disinformers: A mini update of denier waffle at WUWT

Sou | 12:20 AM Go to the first of 49 comments. Add a comment
I admit to being bored with the petty deniers and conspiracy theorists at WUWT. What's happening at the political level in the USA and Australia is much more fascinating in a grim way. Still, until I have a bit more time to focus on the blog, you'll have to make do with this mini-update about the goings on in deniersville - from Eric Worrall, Andy May, Willis Eschenbach and Ira Glickstein, PhD.

It's pretty much the blind leading the blind in the sense that there's none so blind...(nothing to do with vision-impairment).

Tuesday, April 8, 2014

Ira Glickstein's "Natural Cycles" that refuse to cycle naturally

Sou | 3:50 AM Go to the first of 19 comments. Add a comment

Ira Glickstein is a funny one.  He writes for Anthony Watts on occasion.  I don't know if he writes for anyone else.

Today he starts off by claiming to accept the greenhouse effect and human-caused global warming (archived here).  Then he tries to minimise it by making up whatever he feels like making up for the heck of it.  In other words, he rejects science after all.  (Sound familiar?)


Ira's figure plucking


Ira writes about how scientists have shown that earth has warmed by 0.8 degrees and most of this warming is attributed to human causes.  Ira plucks a figure out of the air and says only 70% of it is from human causes. He writes:
I have interpreted “majority” to mean about 70% and have therefore allocated 1°F (0.6°C) to Human-Causation and the remaining 0.4°F (0.2°C) to Natural Cycles.


Ira's personal opinion


He has put up a chart with lots of "bars" and writes (my bold italics):
The seventh bar represents my personal opinion as to the actual Global Warming since 1880, discounting the “adjustments” made by the official Climate “Team” that I believe have inflated the temperature record. 

And later he he writes:
So, unless we believe that the world temperature record is more reliable than the US record, it is likely the world record has also been similarly “adjusted”. Therefore, I have discounted the GISS estimate of Global Warming by about 30%, so actual warming is about 1.0°F (0.6°C). As for allocation of this actual warming to Human- vs Natural-Causes, I believe the IPCC has over-estimated Climate Sensitivity by a factor of two or three, so I have allocated the majority of the warming 0.8°F (0.5°C) to Natural Cycles, and the remaining 0.2°F (0.1°C) to Human-Causation.

Ira talks about reliability, but adjusting data has nothing to do with reliability.  It's to do with accounting for different times of observation or if a weather station is moved or something else happens that needs adjusting.  In regard to global data sets, the global anomaly may be adjusted when more data is added.  (In any one month all the data from all over the world doesn't come in straight away all at the same time.)

Victor Venema is an expert on homogenisation of temperature data and has written a very good blog article about time of observation bias.  These days with automatic weather stations, time of observation is no longer as big a problem.  However weather stations still get moved and other things happen.  If the record isn't adjusted to reflect changes, then the record won't be as accurate.

Basically what Ira is saying is that he doesn't like what the data shows so he's going to make adjustments himself based on nothing at all except for his own bias and "opinion".  He has plucked some numbers he likes better out of thin (if warmer) air.

Now you'll have read how fake sceptics complain that climate sensitivity isn't definitely known to several decimal points.  Yet here's Ira writing stuff like:
I believe the IPCC has over-estimated Climate Sensitivity by a factor of two or three
A factor of two or three! Not two.  Not three.  Not 1.5.  Sheesh, why not go for five or ten while you're at it Ira? Or twenty or thirty?  (No-one complains at WUWT about this.)

The IPCC has estimated climate sensitivity as "likely" being between 1.5°C and 4.5°C.  So if it's overestimated it "by a factor of two or three", then Ira should be putting it at between 0.5°C and 1.5°C or 0.75°C and 2.25°C.  In the end he doesn't say what he estimates it to be.  He just writes:
... I have allocated the majority of the warming 0.8°F (0.5°C) to Natural Cycles, and the remaining 0.2°F (0.1°C) to Human-Causation.

Nor does Ira say what Natural Cycles (note the capitalisation, suggesting Ira's getting on in years) could possibly have caused a rise of his 0.5°C, except for his "natural cycles".  What natural cycles? Why have those cycles never cycled before?

To sum up Ira's article:

  • Global warming = 0.8°C - X = 0.6°C where X = Ira's opinion.
  • The amount of warming from humans = 0.1°C which is derived from science less Ira's opinion.  


Here's the science with Ira's opinion:

IPCC Figure TS.9 showing observations with modeled "natural" forcing only, and Ira's "opinion".

Ira's opinion is not what he stated.  When you look at the above chart, in Ira's opinion, natural cycles have somehow managed to shift the temperature up by 0.6°C not 0.5°C.  But I won't quibble over 0.1°C.  What I will quibble about is Ira's notion of "natural cycle".


Why don't the cycles cycle?


Given that Ira reckon's that it's "natural cycles" that have caused almost all the warming of the past several decades, he must think we're about to get jolly cold. A cycle is a cycle so it's got to come down, right?

And if it was a "natural cycle" why hasn't it shown up already as such?  If it were a natural cycle, then it should have been as hot as it is now in the recent past.  Say the natural cycle had a period of 60 years. That would mean that sixty years ago it should have been as warm as it is today.  Or if you like, as warm as it is today minus Ira's 0.1°C.

It didn't happen. Ergo, Ira is wrong.  Well, you knew that already, didn't you.  He's not just wrong in his "opinion" about the temperature record.  He's not just wrong in his "opinion" about climate sensitivity.  He's also wrong in his "opinion" about natural cycles.


From the WUWT comments


Some people complained about Ira's drawings.  RoHa says:
April 7, 2014 at 12:26 am
I like the point you are making, but that’s a pretty confusing graph. A straightforward bar graph, without the pictures, would be easier to follow.

robr says:
April 7, 2014 at 12:39 am
The graphic is too cluttered. The valid points being made in the text are not being reinforced as well as they should be.

RoHa and robr have a point:
Ira's messy drawing

jaffa says:
April 7, 2014 at 1:03 am
It would be nice to see a bargraph of typical daily/yearly variation (range) before warming next to the same thing after warming, it would illustrate that the warming was insignificant compared to daily/yearly fluctuations and that for most of each day/year the temperature after warming was within the normal range that occured before warming.
This is, of course, why the climate deceit community prefer to use a temperature anomaly instead of actual temperatures, because the numbers just aren’t scary at all.

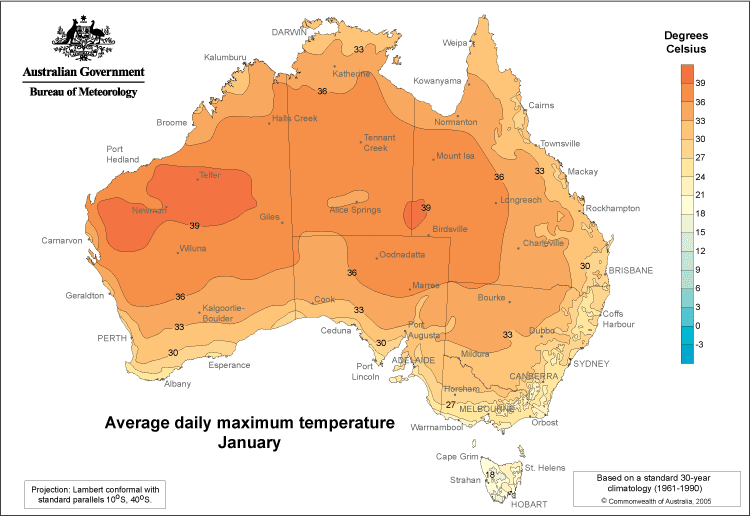
Maybe where jaffa lives he's not had the sort of heat that some of us have endured lately.  Compare the following two charts (click to enlarge them) and it's only just beginning.

Australia's Angry Summer
This is the average January daily maximum for 1961-1990:

Source: BoM


Bruce Cobb is not a farmer (or a fish) and says:
April 7, 2014 at 4:43 am
What “human-caused warming”? There very well could be a tiny amount, but if there, it gets lost in the noise of a complex, multi-layered, somewhat chaotic, and not well understood system. For all intents and purposes, even if theory says it should be there, it is non-existant. It is too small to ferret out, and too small to matter in the slightest.

CodeTech joined in a discussion of what is meant by doubling temperature and says:
April 7, 2014 at 5:06 am
steveta, looks like you fell for the trick question.
The language used by climate change believers and alarmists is often filled with deliberately confusing statements and concepts. In order to double a temperature you need to be aware of where your zero is (and I don’t mean the Oval Office). The only zero that makes universal sense is K.
It was 10C today. Tomorrow will be 20C. The temperature will not even remotely double.


Alex muses over radiation transfer vs kinetic energy says:
April 7, 2014 at 7:14 am
It’s always ‘radiation transfer’ with both sceptics and warmists. I’ve heard very little discussion about kinetic energy. A gas does not have ‘temperature’, it has kinetic energy that manifests itself as ‘temperature’ when it is involved in a physical contact with a surface or another molecule of gas ie exchange of energy. Why this process is never mentioned, I don’t understand.


Mike confuses global with local and doesn't know that he's not being rational when he says:
April 7, 2014 at 7:31 am
Here in Ottawa we have a 60-70 degree C yearly temperature range..a good reason why rational Canadians should ignore the alarmism.
On a related note: in the recently released IPCC impact statement the positive benefits to Canada of warming are trivialized. I cannot think of any negative impacts of 1-2C warming. I am sure the same case could be made for Russia, Scandinavia, Mongolia, etc.

Monday, January 13, 2014

Ira Glickstein's denialist stew: Mix a bit of physics with deception and stir with speculation at WUWT

Sou | 12:55 PM Go to the first of 22 comments. Add a comment

Ira Glickstein has written another WUWT article for Anthony Watts (who's not very good at writing).  Ira takes a bit of physics, mixes it with deception and stirs it up with denier speculation.  I'll just give examples of each component of the denier recipe. (The WUWT article is archived here.)

The physics


Ira writes about the greenhouse effect and how greenhouse gases absorb long wave radiation reflected up from the surface, and emit it again in all directions.  Greenhouse gases have increased - a lot.  CO2 has increased by 40%, which is warming the earth.  I didn't see Ira mention this, but in a warmer earth more water evaporates so there's more water vapour, which is also a greenhouse gas.  A double whammy.

You can read more about the greenhouse effect in this BoM brochure.


The deception


Ira puts up a flawed chart based on one prepared by John Christy.  It's not a chart of surface temperatures. It's not a chart of global surface temperatures. It's a mixed up chart of mid-troposphere temperatures in the tropics.  Within a narrow latitude way above the surface in the troposphere, taken from different sources and superimposed with CO2 increase using different scales.  It might look impressive to people who know nothing about science and who've never presented data in chart form, but it's completely meaningless. It's reminiscent of the potty peer Christopher Monckton. Here is Ira's messy chart with lots of big letters telling his readers what to think.


Source: WUWT


Compare that with the following animation of global surface temperatures.  The data presented here is not just the tropics, nor is it temperature half way up the troposphere.  It shows the temperature anomaly at the land and sea surface - and over the entire surface.  Like Ira, I've also added the CO2 trend.  Unlike Ira, I've gone back to 1959 - as far as there is a consistent instrumental record of CO2 at Mauna Loa.

Data Sources: NASA GISTemp and NOAA Mauna Loa CO2


I've presented exactly the same data in all three charts and only varied the vertical axes.

  1. Scaled min to max actual - shows both temperature anomaly and CO2 with the vertical axes scaled to the minima and maxima of the data
  2. Nincompoop version - the temperature is scaled min to max but CO2 has the vertical axes scaled to make it look as if it's not rising as quickly as temperature.
  3. Denier version - the CO2 is scaled min to max but the temperature has the vertical axes scaled to make it look as if CO2 is rising much faster than temperature.

You can see how the denier version fiddles with the vertical axes until they can get it to look as if CO2 is rising much faster than temperature.  It's an optical illusion.  In fact I would argue all the above are all an illusion of sorts.  You can't tell an awful lot just from eyeballing CO2 and temperatures on the same chart because they are measuring different things, which have different units (degrees vs ppm).   If anything though, scaling both to the min max better illustrates the relationship.


The speculation


Ira wrote (my bold italics):
The IPCC claims that Climate Sensitivity (the average increase in Surface temperatures due to a doubling of CO2) is between 3°F and 8°F (1.5°C and 4.5°C).  Some skeptics (including me) believe they are off by at least a factor of two, and possibly a factor of three, and that Climate Sensitivity is closer to 1°F to 3°F (0.5°C to 1.5°C). As evidence for our conclusions, we point to the fact that virtually ALL of the IPCC climate models have consistently over-estimated future temperature predictions as compared to the actual temperature record. Indeed, for the past 17 years as CO2 levels continue their rapid climb, temperatures have leveled off, which is proof that Natural Cycles, not under human control or influence, have cancelled out warming due to CO2 increases. Thus, Natural Cycles must have a larger effect than CO2.

That's nuts.  How does Ira know that future temperatures are over-estimated?  The future hasn't happened yet.  There are no "actual" temperature records of the future.  If Ira is hanging his hat on the fact that observations are at the low end of the models now, then he's got things back to front.  The natural cycles haven't "cancelled out" any warming.  What's happened is that the deeper oceans have been joining in the warming.  Ira will be very disappointed.

Ira is putting all emphasis on the latest denier meme, quoting "for the past 17 years".  Let's look at what's happened in the "past 17 years".

Data Source: NASA GISTemp

Seventeen years ago is 1996 - you can see more evidence of how the world has warmed since 1996 here.

You may have noticed that Ira doesn't explain how, when temperatures have already risen by 0.8 degrees with only a 40% increase in CO2, climate sensitivity (a doubling of CO2) could lead to a rise of only 0.5 degrees.  Even if 0.3 degrees were attributed to more incoming solar radiation (which is not that high at present), there's still another 60% increase in CO2  to go (another 170 ppm or so) before we get to a doubling of CO2.

Ira is saying he accepts the science to a point before his denial takes over.  He doesn't want to "believe" that the earth will warm a lot as long as we keep adding more and more CO2 to the atmosphere.  He's a great risk taker.  A foolish risk taker.  And he is trying to deceive people with his personal speculation that "scientists don't know nuffin'".


From the WUWT comments


If you thought WUWT deniers were moving toward the science, think again. All the greenhouse effect deniers popped out of the WUWT woodwork in response to Ira's article.


Elizabeth is ever hopeful that time will vindicate her and says:
January 12, 2014 at 3:29 pm
You are assuming that some of the “warming” is due to humans/ Well as a scientist with 4 higher degrees in statistics I am assuming that you are 100% wrong you do not have the faintest clue whether it is or not/ Sorry I am now a 100% denialist and proud of it. I think time will vindicate me.

David Wells blames it all on Al Gore and says:
January 12, 2014 at 3:34 pm
What a load of blx! Just 1% of which 96% is natural is a determining factor bit it doesnt stop ice ages and if believed to be true temp rises before co2. The truth is no one has a clue and even if they did they couldnt do anything about it, one side of the argument is corrupt as the other the only difference is that Al Gore and his mates have made millions and the other side have not, who dares wins!


richardscourtney shouts a bit in protest and says "there is no evidence" (excerpt):
January 12, 2014 at 3:52 pm
Friends:
...What can be said is that to date there is no evidence for discernible global warming from human activities so any human contribution to observed global warming is trivial if it exists.
Richard


P@ Dolan says "CO2 is from volcanoes not burning fossil fuels" (excerpt):
January 12, 2014 at 4:13 pm
In two places, the author as claimed as fact that mankind’s unprecedented burning of fossil fuels is responsible for the majority of the increase in atmospheric CO2 (” Most of the increase in Atmospheric CO2 (a 40% rise from about 270 to nearly 400 parts per million by volume) is due to human activities.”).
This assertion is unproven, and as far as I know, largely unexplored. We know that there are a number of undersea volcanos which spew incredible amounts of CO2 into the seas, but how much? How many volcanos? How long for any of that CO2 to reach the atmosphere? Plus, how much atmospheric CO2 is due release from other sinks due to post LIA warming?


lowercasefred wins the "comment of the day" beating some others by a nose, and says the earth is warm because of radioactive energy in the core:
January 12, 2014 at 4:16 pm
People who are looking for “warming” due to the greenhouse effect are barking up the wrong tree.
The greenhouse effect slows the rate of cooling.
As calculated by Lord Kelvin over a century ago the earth should be frozen. It is not because of radioactive energy in the core. The greenhouse effect slows the rate of energy loss.

Gregory says of the title: "Global Warming is REAL but NOT a Big DEAL"
January 12, 2014 at 4:28 pm
Not a helpful title, Ira.

Friday, October 11, 2013

Where is the cooling, Ira Glickstein? It's a travesty...

Sou | 10:38 PM Go to the first of 6 comments. Add a comment

Today I came across a comment on WUWT by the Village Idiot.  Village Idiot was responding to an article by Ira Glickstein looking at the differences in projections in the various IPCC reports (archived here, update here).

Village Idiot says "it's a travesty":
October 10, 2013 at 11:58 pm
As you so rightly say, Ira, all the signs and portents are there in the sun, heavens and sea. They have been for years. Now, I’m a non-expert on matters of climate, but I find it’s a travesty that we can’t account for the lack of cooling at the moment, which was prophesied by High Priest Don, and posted on the Village notice board back in 2008:
http://wattsupwiththat.files.wordpress.com/2008/12/agu2.png
Where is all Easterbrook’s cold hiding? I think some of its going into the extra ice in the Antarctic. Any other suggestions?

What about the cooling?


Some time ago I put together a collection of various alarmist predictions from WUWT including Denier Don's 2008 prediction. Or to go directly, you can  click here for an archived copy of the Denier Don's 2008 prediction at WUWT itself.  At the time Don wrote:
The sun’s recent behavior suggests we are likely heading for a deeper global cooling than the 1945-1977 cool period and ought to be looking ahead to cope with it.
Below is the image of Denier Don's predicted cooling.  I've highlighted his "deeper global cooling than the 1945-1977 cool period" and shown Don's prediction compared to 2012 global surface temperature.  Yes, it's messy because Don's charts are kinky and have all sorts of odd stuff (like his "warm" and "cold" and "cool" categories).  Click to enlarge:

Source: Adapted from Easterbrook (2008) at WUWT


What is causing the warming?


I looked back to see what Ira Glickstein has done in the past at WUWT.  Two and a half years ago he took a poll of WUWT readers (archived here) to see how much they thought global warming of 0.8 degrees Celsius should be apportioned to three things.  The results in degree Celsisus were as follows - all to 3 decimal places!

  • human (AGW) 0.179 (0 to +0.7) - Ira = 0.100
  • natural cycles 0.331 (0 to 0.55) - Ira = 0.400
  • data bias 0.275 (0 to 0.65) - Ira = 0.300


It's a fairly good example of wishful thinking, particularly the emphasis many people put on data bias.

A quick search didn't lead me to any quantitative prediction Ira has made in the past in relation to global surface temperature.  However, for the record, he has today made a prediction for the temperature in 2035.  He predicts no change from the current surface temperature between now and 2035.


Comparing IPCC projections


Ira did an interesting comparison of projections from previous IPCC reports with those of the current report.  I don't think he was correct in highlighting the mean of the projections, but that's a relatively minor quibble.

Rather than show his chart, I made up one of my own into an animation, flipping through the previous and current projections and showing Ira's projection compared to the current AR5 range. As always, click the image to see the larger version.

Adapted from TFE.3, Figure 1: IPCC WG1 Technical Summary (page TS-96)


Illogical conspiracy ideation


Ira does make the common misplaced complaint:
I’m optimistic about the future! Unlike some of the Alarmists and Warmists who actually hope for a climate catastrophe to justify their decades of shrill Catastrophic Anthropogenic Global Warming (CAGW) warnings, I’d prefer a future without such problems. Indeed, I hope that the cooling trends listed above do not result in excessive cooling which would be far more dangerous than the moderate warming we have experienced over the past century.
Attributing nefarious intent, as Ira does, is a feature of conspiracy ideation.  I'm not saying that Ira is a conspiracy theorist, but he's clearly inclined towards it by saying that "Alarmists and Warmists" actually hope for a climate catastrophe.  Why are science deniers so silly about this.  Why on earth would people who understand science be wanting to reduce carbon emissions if we were "hoping for a climate catastrophe"?  We'd be working against achieving our goal!  Logic is not a strong suit of science deniers.

---o--- Update: Ira Glickstein has taken the trouble to write a comment below, explaining that he is indeed more than merely 'inclined' towards conspiracy ideation. ---o---

And it's odd how deniers are unable to face facts.  Cooling trends? What cooling trends, Ira?

Data source: NASA


How hot do we want to get?


Before moving on to the comments, it's worth looking at the carbon budget to figure out how hot we want to get, from the IPCC AR5 Summary for Policy Makers (page SPM-35):

Source: Adapted from IPCC AR5 SPM


From the WUWT comments


So far there haven't been very many comments at WUWT (archived here, update here).  I guess most readers are still asleep.  There was a bit of to-ing and fro-ing on the matter of "projections" versus "predictions".  Then the Village Idiot chimed in with his "where is the cooling hiding" question.  

The playground monitor, richardscourtney tried to get people to behave in the manner in which richardscourtney thinks they should behave and say things that only richardscourtney approves of, writing (this time without shouting a single word):
October 11, 2013 at 1:24 am
Ira Glickstein:
Thankyou for this contribution.
It is to be hoped your presentation will evoke the serious discussion it deserves concerning the failure of past IPCC predictions and the adherence of IPCC AR5 to ECS estimates which are obviously too high.
I am sorry such discussion has been inhibited by the start of the thread being trolled by the ‘red herrings’ of Terry Oldberg and Village Idiot. Take pleasure from the knowledge that they would not have bothered to try side-tracking the thread if your point were not made well.
Oldberg knows he is spouting nonsense because it has been explained to him several times on many WUWT threads. The Idiot only ever spouts nonsense with intention of disrupting threads.

Terry Oldberg was explaining to people the difference between a projection and a prediction.  It looks as if richardscourtney has decided that when the IPCC says "projection" it really means "prediction". (The man would be impossible to communicate with if he were to substitute his own meaning to everything one were to say.)


Deniers are a very patient lot.  J.Seifert is still expecting Denier Don's cooling to come out of hiding sooner or later and says "it's just a matter of some more time" for "detailed celestial mechanics" to unveil the hidden cooling (is that a reference to God in the ++:
October 11, 2013 at 2:17 am
Point 3 is the major climate driver:
It says: “” 3) We seem to be entering a downturn in the multi-decadal cycle of warming and cooling. ……. An approximately 60-year cycle of warming and cooling seems to be superimposed on that general warming trend ……..”"
This 60 year cycle is explained by Nic. Scafetta in his recent papers. In coming years,
science will take a closer look into this cycle nd will determine its detailed celestial mechanics….
its just a matter of some more time.
As PDO and AMO enter cold phases, there is no somewhere hiding missing heat, rather
less incoming heat, due to astronomical changes in the Earth´s orbit.

Izen notes that Ira Glickstein's prediction is in conflict with paleo evidence and points to other problems with Ira's prediction, which is the bit in italics (extract, you can read the rest here):
October 11, 2013 at 2:48 am
1) IPCC ECS estimates are two or three times too high. I believe the true ECS is closer to 1°C than the 2°C to 3°C claimed by the official climate Team.
That belief is on direct contradiction with evidence from the paleoclimate. It is very difficult to make such low ECS values compatible with the glacial cycles.
2) Daytime clouds, thunderstorms and related natural phenomena have net cooling effects. The way these phenomena are modeled by the IPCC models is basically wrong. I subscribe to the Thermostat Hypothesis put forth in 2009 by Willis Eschenbach that these phenomena counteract some of the warming effects of greenhouse gasses.
As Dr Spencer has pointed out the thermostat hypothesis was proposed by many other before willis Eschenbach co opted it. Empirical observation has failed to find any supporting evidence for such negative feedbacks ever since Lindzen and the failure of the iris hypothesis.

PS I'd take my hat off to Village Idiot if I wore a hat.  She or he provides a source of well-targeted humour to alleviate the boredom of wading through mindless comments from the scientific illiterati at WUWT.